Commute Time as Quality Time
Exploring the factors that contribute to a better commute
Americans spend a lot of time commuting to and from work: about 50 minutes per day, on average, according to the 2017 National Household Travel Survey. This adds up to about 200 hours per year for full-time workers, assuming the usual two weeks of vacation, major holidays, and a few sick days along the way.
To put things into perspective, this is more than enough time to stream all 12 seasons of The Big Bang Theory or, if you prefer, all 11 seasons of M*A*S*H, including the two-hour series finale. Twice.
The quality of that time matters: Spending 200 hours per year in a stressful, unenjoyable commute can be a significant drain on one’s general happiness and well-being, as a new and growing body of research from the United States and around the world has shown. Finding ways to improve commute quality – and indeed the quality of all travel – is thus an important goal of transportation planning, and better understanding the factors contributing to one’s commute quality is a necessary starting point.
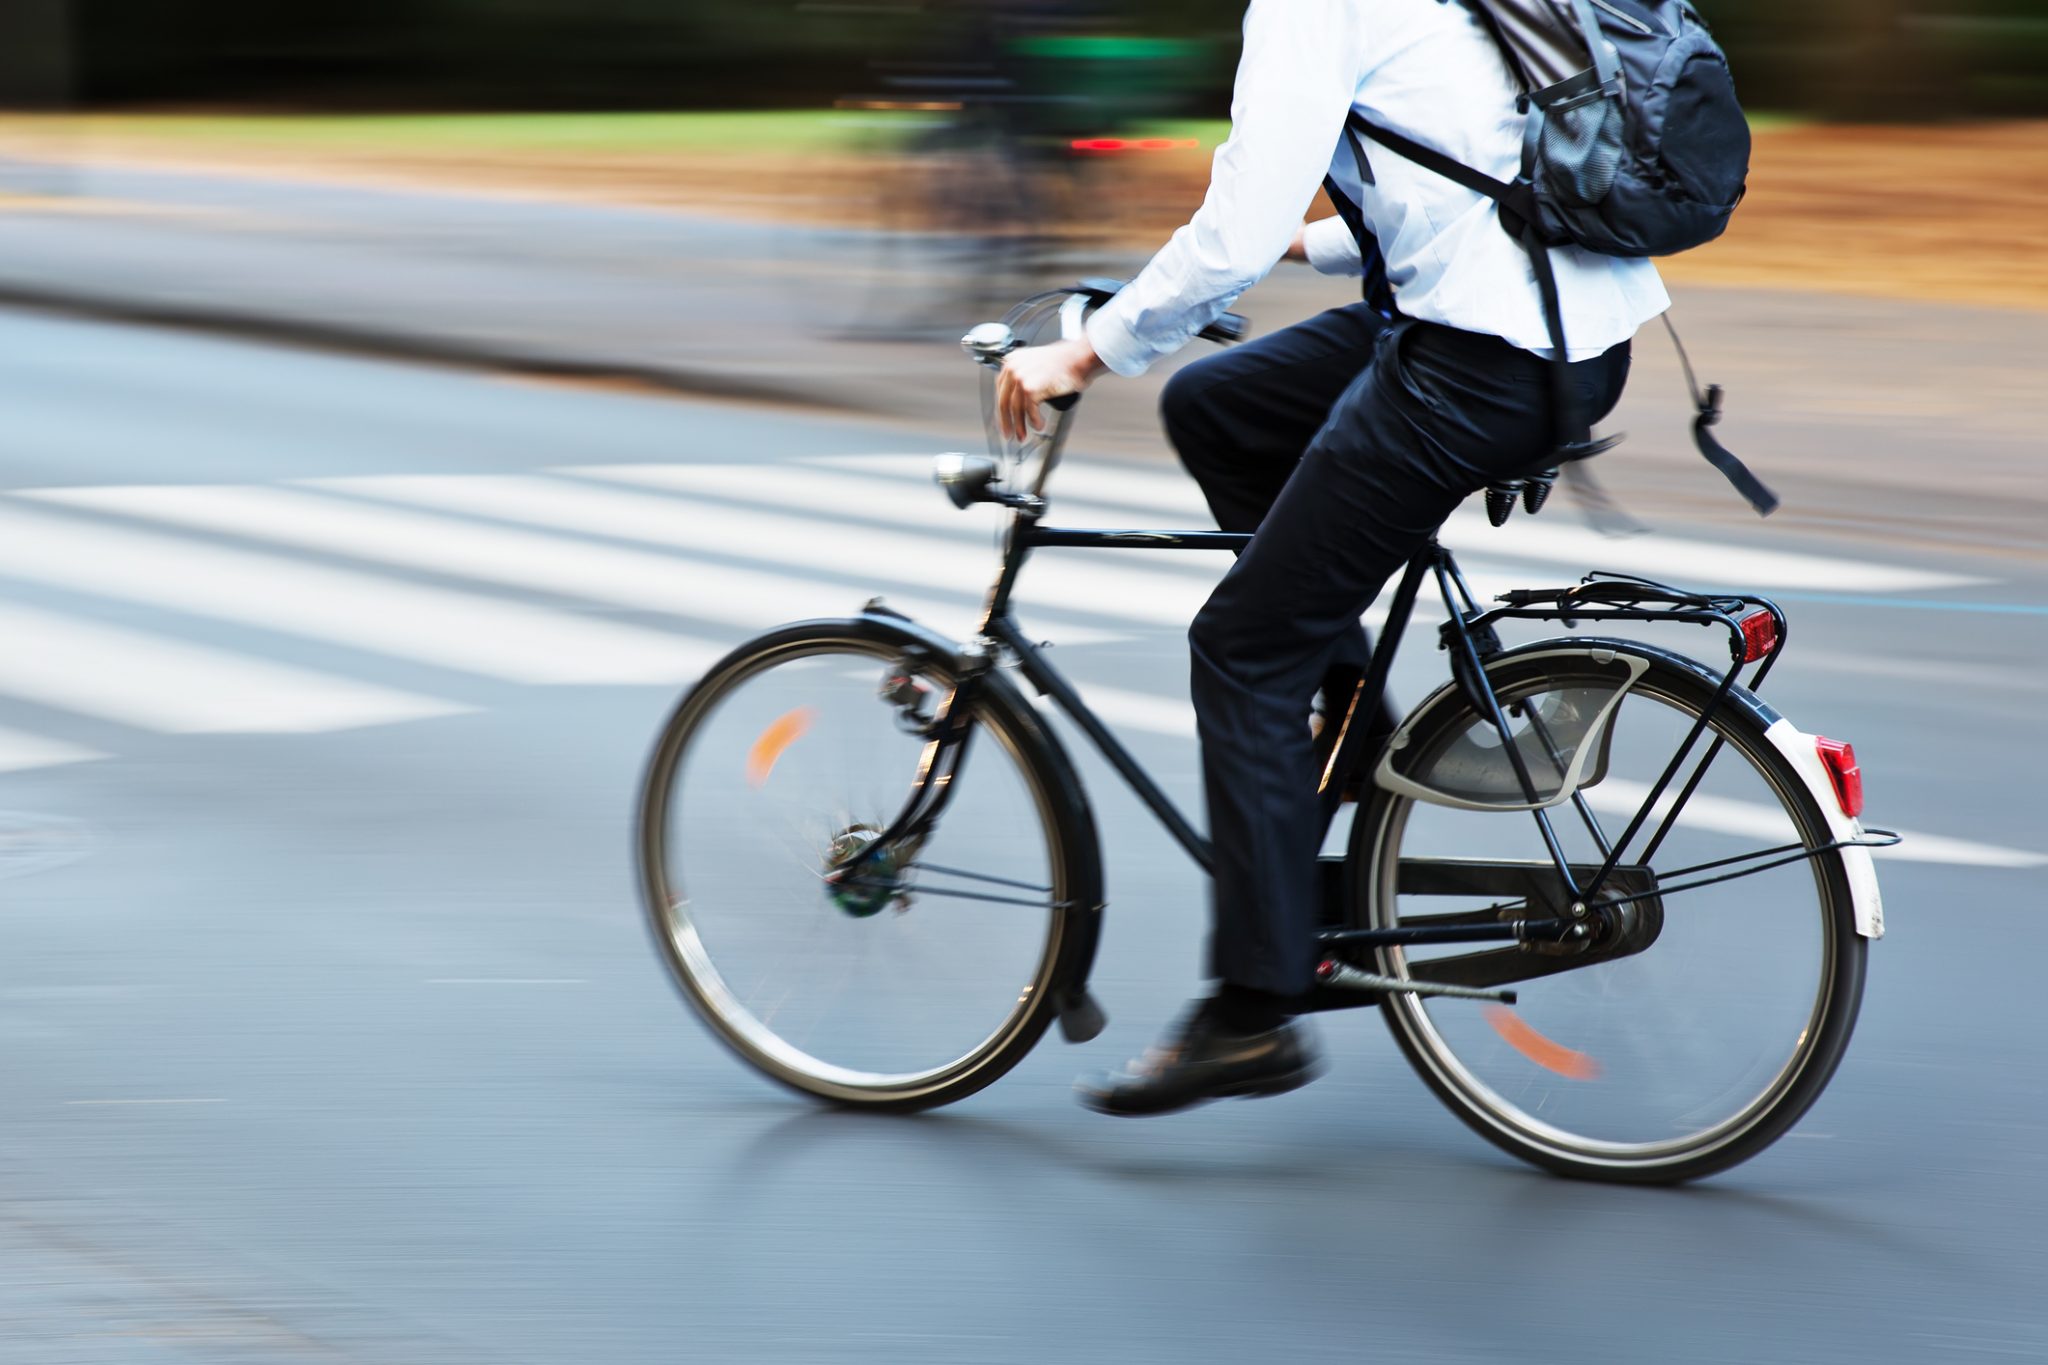
To this end, we explored factors associated with perceived commute quality and commute satisfaction using data from the annual UC Davis Campus Travel Survey. UC Davis is an ideal case for a study of commute quality, in that many of those traveling to and from campus have more than one viable way to get there. Bicycling is common in Davis, which is well known for its extensive bicycle infrastructure, and over 20 percent of commuters usually bike to work. Frequent local transit service and nearby commuter rail service make public transit an attractive option as well. The competitiveness of alternatives to driving for UC Davis commuters makes it possible for us to delve into factors other than travel time that might contribute to commute quality.
Our analysis focuses on the commute to campus for both students and employees. In measuring commute quality, we focused on three dimensions of the commute experience: how “stressed out” the trip to campus made commuters feel, whether they saw travel time as wasted time, and the degree to which they liked their usual commute mode. We also used a composite measure of commute satisfaction based on respondents’ levels of agreement with six statements, such as “my commute trips are the best that I can imagine.” Our dimensions of commute quality proved to be a strong predictor of commute satisfaction, so we focused our analysis on the factors influencing quality. Our findings point to an array of strategies for improving commute quality and satisfaction.
General patterns of commute quality and satisfaction
We looked at differences in commute quality and satisfaction by travel mode (e.g. walking, biking, public transit, driving), gender, campus role (i.e., student, faculty, staff), and residential location. In our UC Davis sample, these factors are somewhat intertwined, particularly mode and residential location. For those living within the city of Davis, driving, walking, bicycling, and taking the bus are all feasible, depending on how far one lives from campus. For those living outside of Davis (who, because of agricultural land preservation policies, tend to live 10 or more miles from campus), the primary modes are either driving alone, carpooling, or taking a regional bus or train — though a small number of hardy commuters living outside Davis do commute by bicycle on occasion.
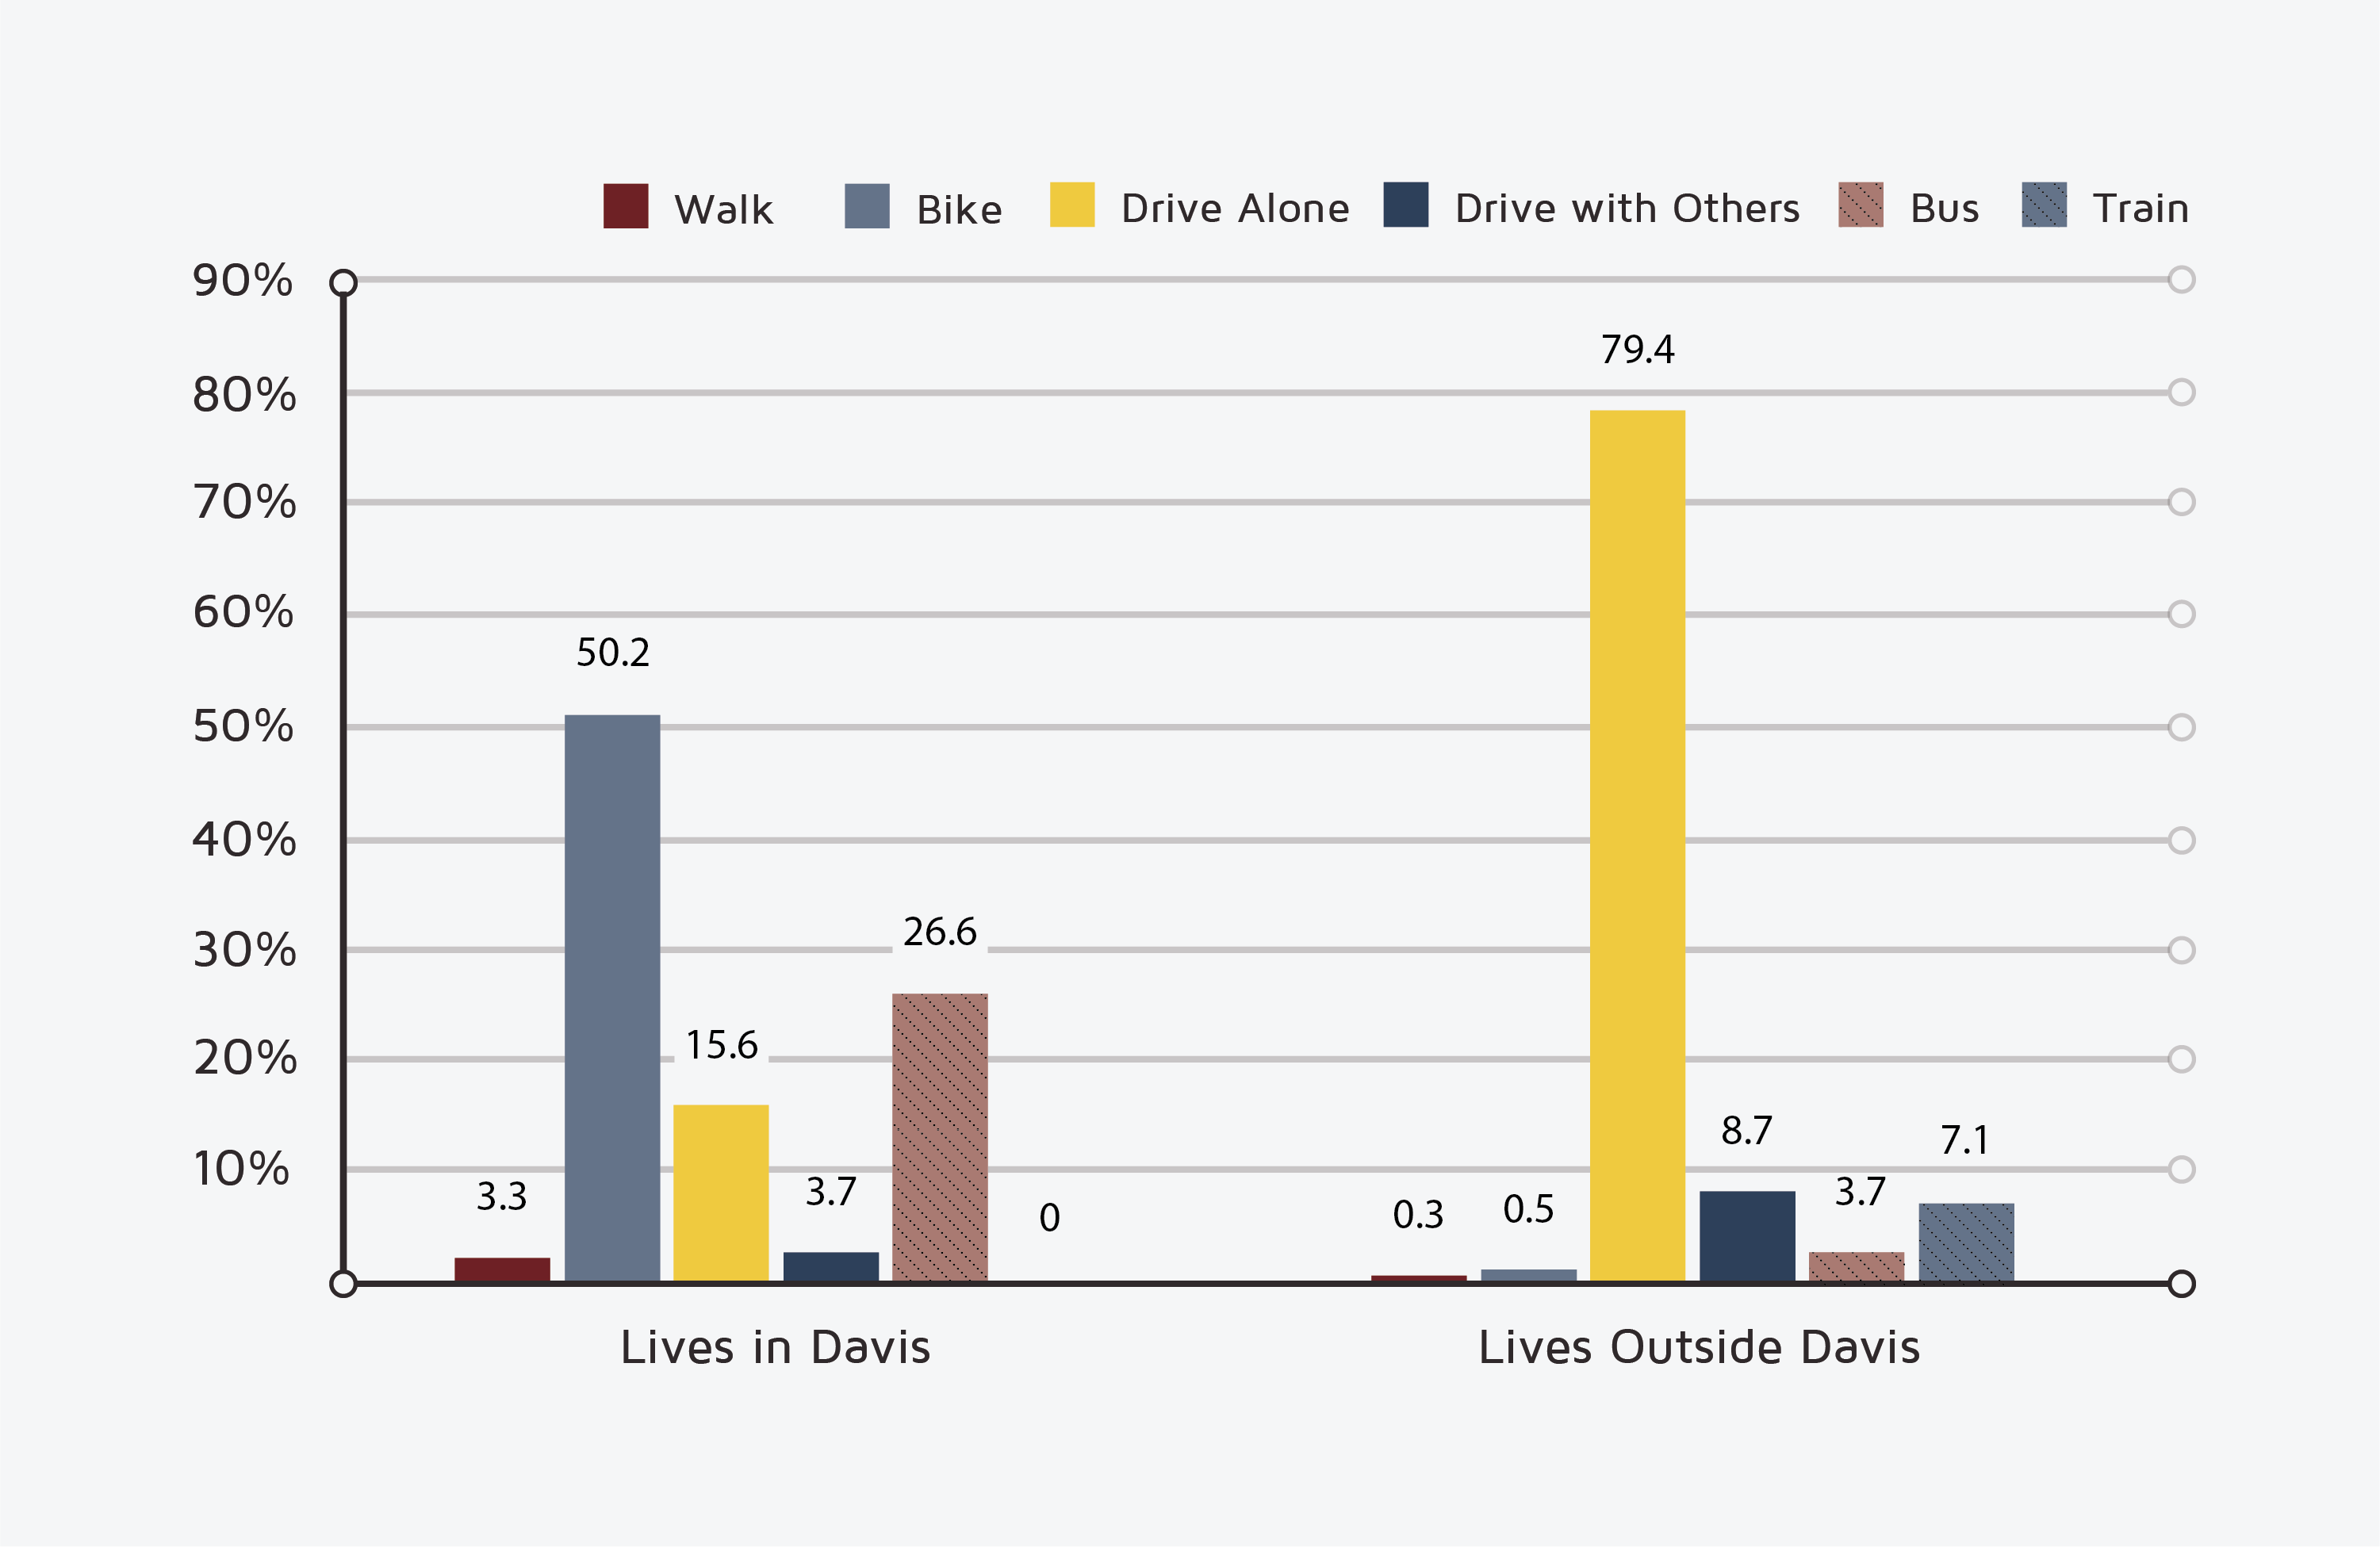
Travel mode shares reflect the different options available for both in-town and out-of-town commuters (Figure 1). In addition, campus role and gender are both tied to residential location and, thus, mode. Most students live in Davis, as do most faculty members (who are disproportionately men), but most staff members (who are disproportionately women) live outside of Davis.
Figure 1. Mode share by residential location
These patterns are important to consider given significant differences in commute quality by mode. Bicyclists have the highest quality commutes: For most, the commute is not stressful, they do not feel that their travel time is wasted, and they like their mode. Although the sample of walkers in this study is small, they too report low stress and disagree that travel time is wasted. The train offers the highest quality commute (next to biking) for those living outside of Davis: Train riders do not think their travel time is wasted, plus they tend to like their mode. Bus riders and car drivers fare worst: They are more stressed, feel their travel time is wasted, and like their mode less than users of other modes. Commute satisfaction follows a similar pattern: Bikers and walkers are the most satisfied, with train riders next and drivers (alone or in carpools) and bus riders far behind. Reflecting the human tendency to adjust one’s preferences to one’s situation, no matter how suboptimal, users of all modes are satisfied on average.
Who has the worst commutes?
Three key stories emerge when we look at the relative commute quality of different campus groups.
Living outside of Davis
Residential location has a substantial impact on commute quality and satisfaction. Over 40 percent of those living outside of Davis report feeling stressed by their commutes. They are more likely to report that their travel time is wasted time, and they are less likely than those living in Davis to like their commute mode. While Davis residents are largely satisfied with their commutes, those living outside of the city are neutral on average. These differences are clearly tied to longer commute distances as well as differences in mode share: Owing to distances too great for biking or walking, coupled with limited transit service, nearly 80 percent of commuters living outside of Davis drive alone to campus, and as noted above, driving fares poorly on all measures of commute quality.
The story is much rosier for those who commute to Davis by train, however. Almost two-thirds of these commuters disagree that their travel time is wasted time, and they feel far less stressed than those who drive. Nearly nine in 10 respondents say they like their commute mode, nearly as high a rate as for bicycling. Their satisfaction levels are also high, though train commuters still report a lower commute quality compared to bicyclists and walkers living in Davis. Why more commuters do not take the train, given its higher quality, can be explained by its limited service area (a narrow corridor between Sacramento and San Jose) and its relatively high cost (though the university subsidizes the fares). The fact that many commuters living outside of Davis do not realistically have the option to ride the train adds to their commute dissatisfaction: Commuters with only one viable mode available to them are less likely to agree that they like their modes than those who have multiple options.
Undergraduates
Of all those surveyed, undergraduates report the worst commutes overall, a result related to their high share of bus commuting. Among the undergraduates living in Davis, which is most of them, nearly equal shares ride a bike or bus to campus (40 and 44 percent, respectively). In fact, undergraduates make up the vast majority of bus commuters, largely because they can board the university-run buses for free with their student IDs. However, four in 10 bus riders report their travel to campus stresses them out, the highest amount across all commute modes.
Why then do so many undergraduates ride the bus rather than bike, the mode that rates highest on our measures of commute quality? A dislike of bicycling may provide much of the explanation. Eighty-six percent of undergraduates who bicycle agree that they like biking, whereas just 47 percent of those riding the bus report liking biking, and 31 percent of bus riders dislike biking. In other words, those who take the bus might do so because biking would be even more stressful.
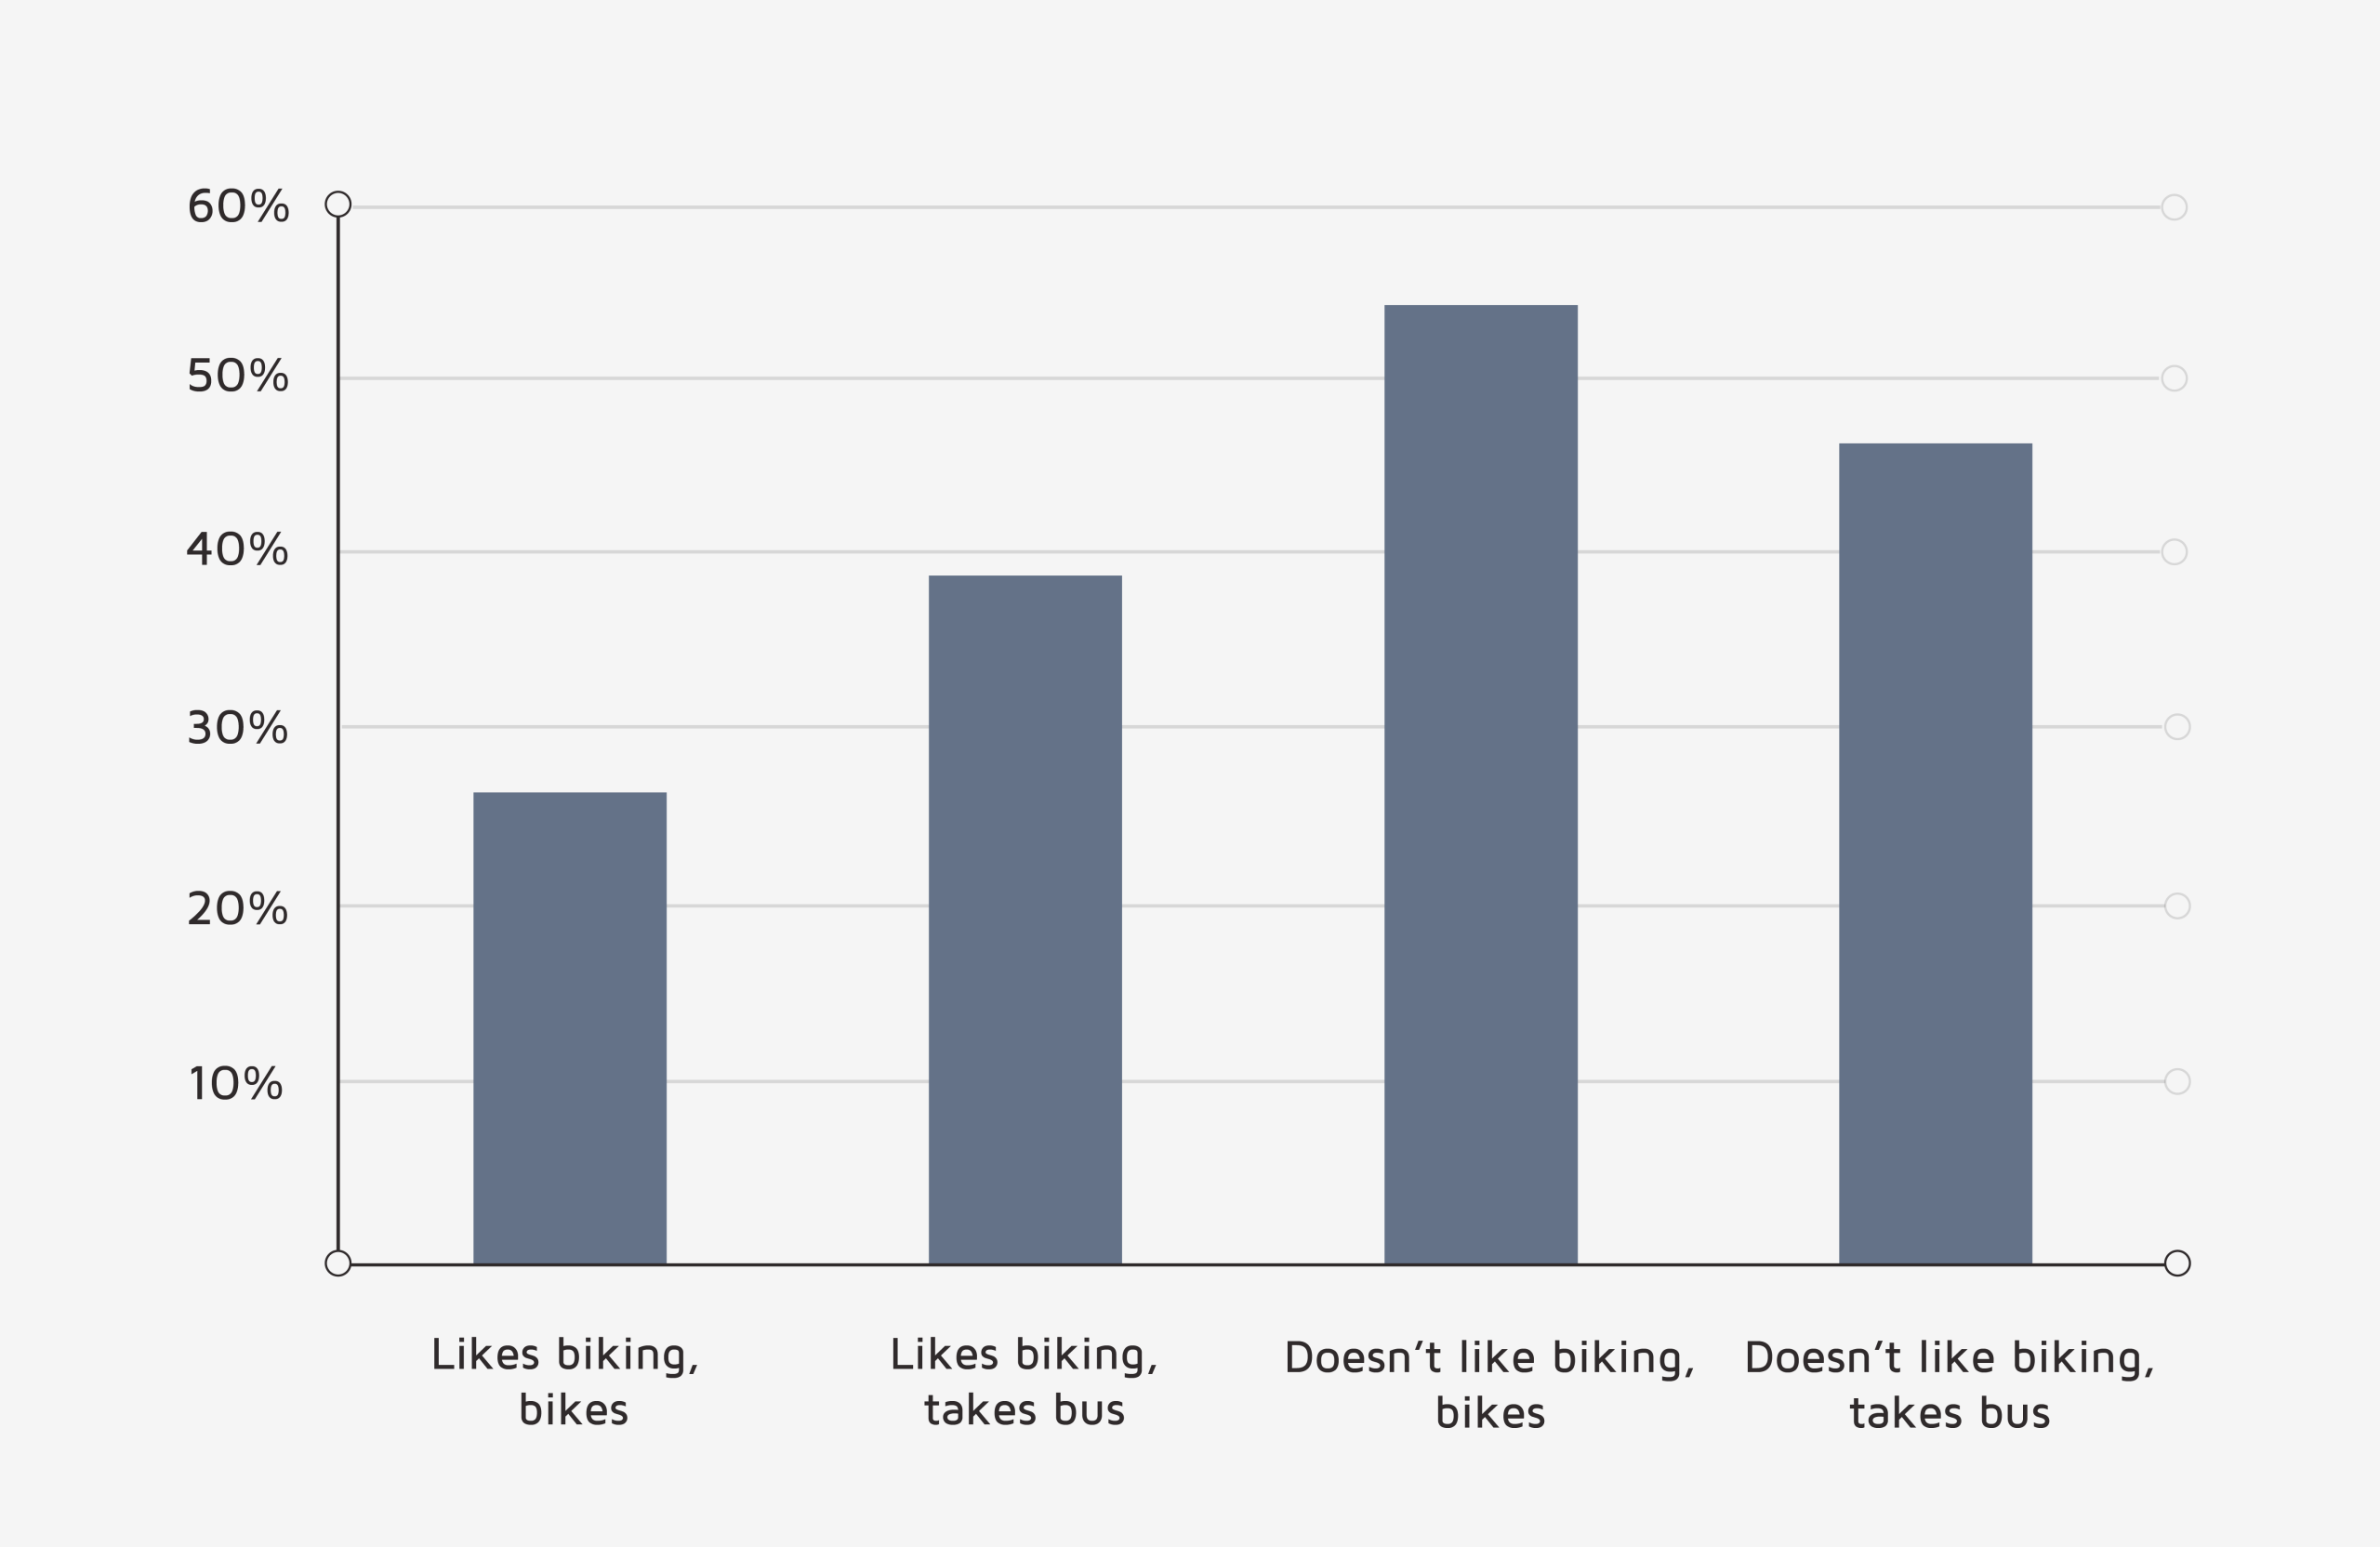
A closer look at the relationship between mode, mode enjoyment, and commute stress for undergraduates adds additional nuance. The students who bike and who like biking are by far the least likely to report stressful commutes of all students, while students who like biking but take the bus report stressful commutes at a much higher rate. (Why the latter students are not biking is an interesting question; anecdotally such students often cite stolen or broken bicycles as the reason.) Students who don’t like biking report the most stress of all, whether they take the bus or bike (Figure 2). Is there a fundamental difference between students who like biking and those who don’t with respect to their general stress levels? This is a possibility we will be exploring in future research.
Figure 2. Percent of undergraduates agreeing that “traveling to campus stresses me out,” by mode
Women
The situation for women is complicated. When we estimate a statistical model for commute satisfaction — controlling for location, campus role, and mode — women appear to be more satisfied with their commutes than men, all else equal. That is, when a woman and a man have essentially the same commute, the woman tends to report slightly higher satisfaction.
But all else is not equal.
Women report lower quality commutes on all three dimensions: more stress, more sense that travel time is wasted, and less liking of their modes. They are also more likely to live outside of Davis, where they have fewer commute options, and to be staff members with lower salaries on average than faculty members. Among those who live in Davis, women are less likely to bike than men, perhaps owing to greater responsibilities for childcare and other household duties.
In the interest of full disclosure, I am compelled to report that faculty members clearly have it best, with the highest levels of satisfaction and the lowest perceptions of stress and wasted time. With higher average salaries than staff, they are more likely to live in Davis, where the highest quality commute options of walking and bicycling are possible, and they may find it easier to afford the train if they live outside of Davis. But faculty are far more satisfied with their commutes even after accounting for differences in commute quality, perhaps owing to more control over their daily schedules or even to greater satisfaction in other domains as might result from greater income, job security, and intellectual fulfillment.
Improving commute quality
Like many employers, UC Davis has established the well-being of its students and employees as an important goal, for which commute quality clearly plays an important role. If an employer like UC Davis wants to increase commute quality so as to increase well-being, what can it do? Given the strong connection between mode and commute quality, two paths are possible: improve each mode to reduce stress and increase enjoyment, or enable and encourage commuters to switch to higher quality modes.

Given the strong connection between mode and commute quality, two paths are possible: improve each mode to reduce stress and increase enjoyment, or enable and encourage commuters to switch to higher quality modes.
Transportation planning efforts in the region have long aimed toward the former, and our results suggest the need for improvements to bus service. But the fact that the modes yielding the highest quality commutes are also more environmentally sustainable than driving alone offers an additional reason to pursue the second aim: a mode shift. Indeed, UC Davis is now developing a comprehensive transportation demand management plan with the goal of reducing its drive-alone mode share.
Shifting commuters to higher quality modes would clearly lead to higher overall satisfaction. For UC Davis, this means getting more Davis residents bicycling to campus and getting more of those who live outside of Davis commuting by train. The university already offers incentives to use these modes through its Go Club, which provides discounted train tickets, among other incentives. Of course, it is important to consider mode self-selection: Commuters generally use the modes they do for good reasons, including the satisfaction that they derive from that mode. So successfully enticing commuters into other modes might not increase their satisfaction. For example, undergraduates now taking the bus might find bicycling far more stressful and less enjoyable; employees driving alone might be less able to make productive use of time on the train than those currently taking it.
Given the likelihood many commuters already travel by the mode that suits them best, even if they aren’t particularly happy with it, employers like UC Davis might do well to focus on two types of strategies. First, they might identify “mismatched” employees – employees who are not using the mode that would be the most satisfying for them. Some commuters may actually want to switch modes but need just a small nudge or a bit of assistance to do so. Second, the university might target underlying mode perceptions and preferences through social marketing techniques. In other words, they could help their students and employees see how other modes can be less stressful and more enjoyable.
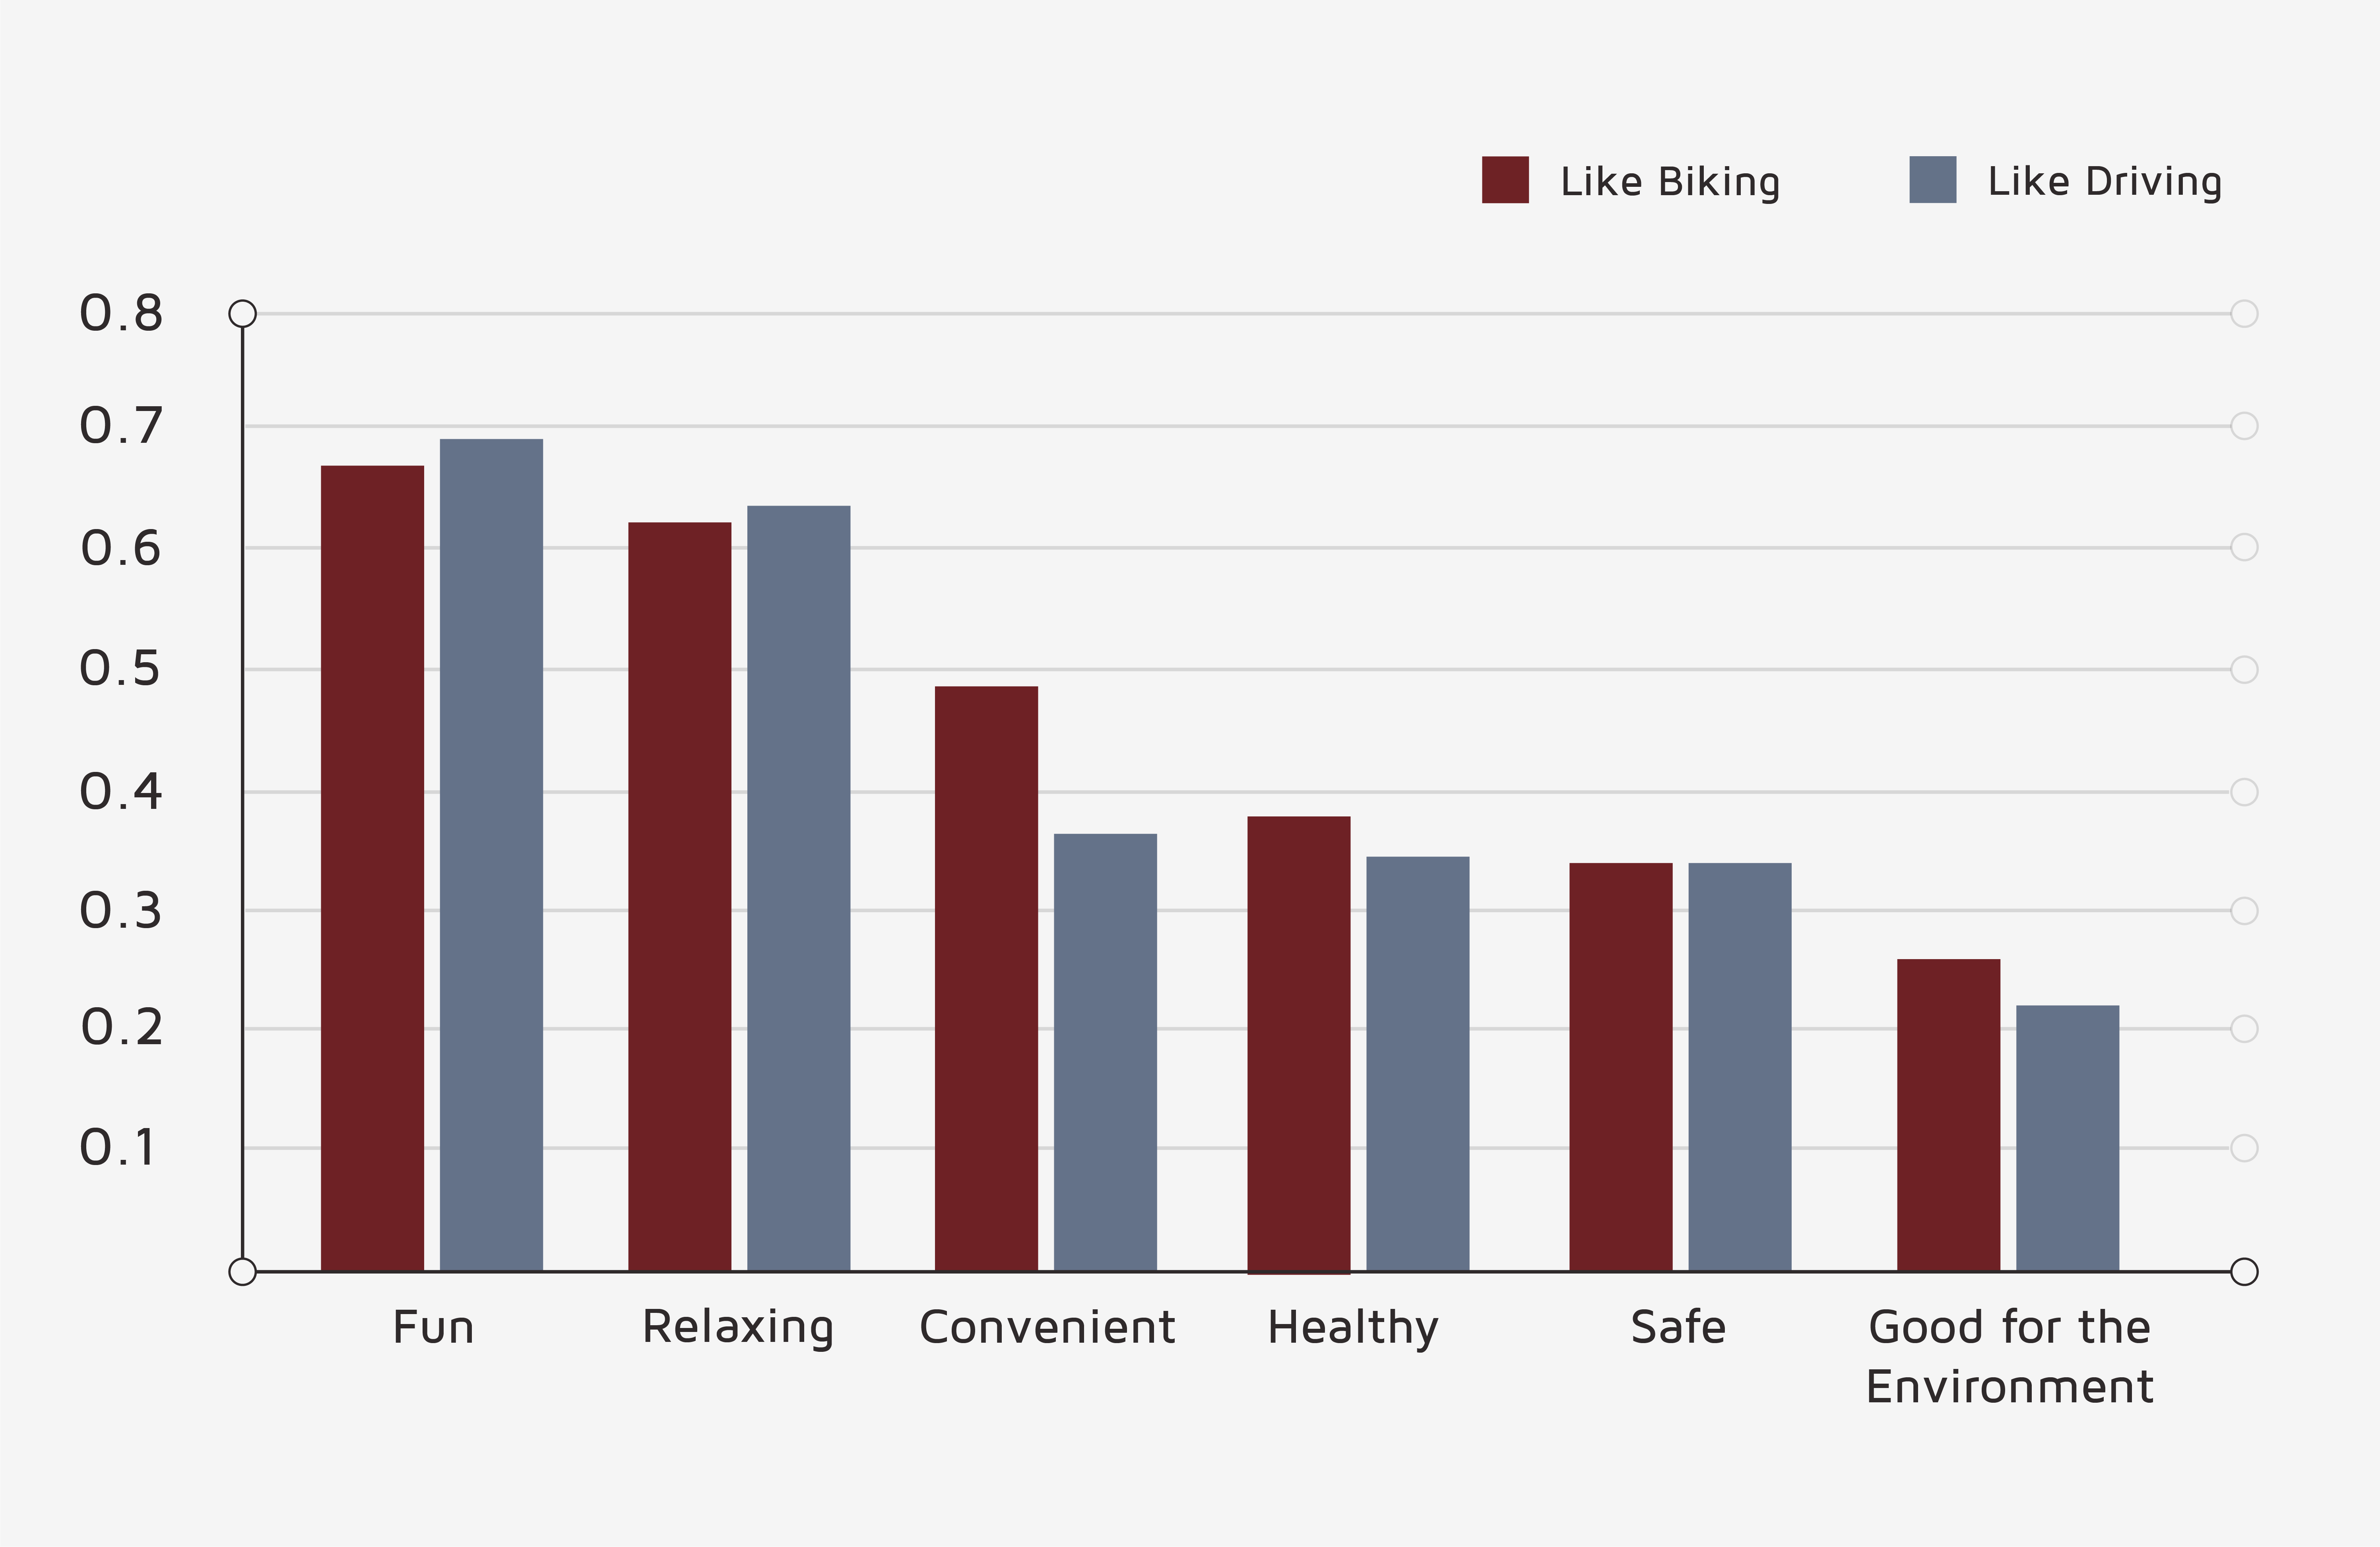
Enjoying the commute mode is especially important to efforts to get people to switch. If commuters do not like something, they are less likely to choose it and will report less satisfaction when they do. We thus delved further into this question for driving and biking with an additional set of questions in the survey, focusing on the role of beliefs about these modes. Not surprisingly, bicycling scored far higher than driving on being good for the environment and being healthy, and somewhat higher on being fun and relaxing, while driving won on convenience and safety (Figure 3). But while beliefs about the two modes differ significantly, the aspects most closely tied to liking are the same for both modes: Believing that the mode is “fun” and “relaxing” have the strongest correlations with liking the mode (Figure 4). Stay tuned for the results of my future exploration of what makes, at least for some of us, biking fun.
Figure 3. Beliefs about biking and driving
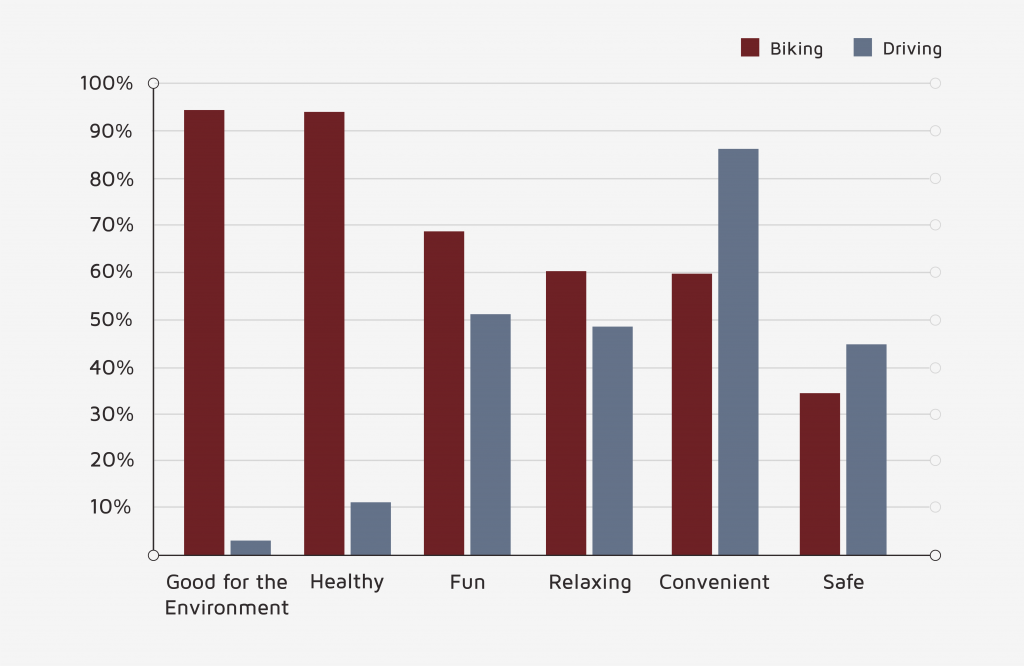
Figure 4. Correlation between liking and belief
Hanging over this entire discussion is the question of whether students and employees are living outside of Davis by choice or necessity. If the latter, then another strategy for increasing commute quality is to increase the feasibility of living in Davis. The university already has plans for price-controlled housing for staff and faculty to be built on university-owned land; the city also has policies that encourage more affordable housing. For those who choose to live in Davis, the possibility of a high-quality commute by bicycle or at least a shorter and thus higher quality commute by car may help to compensate for higher housing costs, or even be a primary motivation for this choice. Land use policies are thus an essential complement to – and indeed an essential component of – strategies that aim to improve the quality of modes and encourage commuters to shift to higher quality modes.
Of course, this is Davis, and Davis is rather different from other places. Still, several of the findings here have general relevance to transportation professionals concerned about commute quality and its impact on well-being.
The contribution of the stress of the commute, the sense of wasted time, and the liking of the commute mode to overall commute satisfaction is certainly universal. The emergence of bicycling and walking as the highest quality and most satisfying commute modes echoes many previous studies, as does the finding that commuting by bus is far less satisfying and that train travel is far superior to bus. That some groups have worse commutes than others is also a problem everywhere, with the groups with the greatest constraints generally facing the least satisfying commutes. Together, these findings point to ways in which planners can improve commute quality. They are an important complement to the growing evidence that providing high quality options for both mode and residential location can improve commuters’ quality of life.