Worst-Case Scenarios: Flooding and Evacuation Plans in Honolulu
Climate change exposes coastal cities to more damaging flood events, especially on roadways
Like other coastal cities, Honolulu’s long-term viability depends on how well it can adapt to climate change. By 2100, sea levels are predicted to rise by at least a meter worldwide alongside an increasing number of extreme weather events.
How the one-two punch of sea-level rise and more flooding hazards will affect people and infrastructure cannot be viewed in isolation but must be seen as part of a broader pattern. Sea level rise exacerbates flooding in coastal areas, which can then be compounded by extreme weather such as storm surges, tsunamis, and even fires. Policymakers and planners in Honolulu and elsewhere must understand plausible worst-case scenarios to “prepare for the worst and hope for the best.”
To understand what the worst would look like, we quantified flooding risks in Honolulu due to sea level rise and severe weather events and assessed the risks and vulnerabilities of critical infrastructure. This included threats to the city’s transportation system, for which we used travel demand software to model evacuation from inundated areas. Our approach provides critical information for emergency responders, transportation systems managers, planners, and developers that inform potential policies to protect the city and its residents.
Assessing hazards
The risks associated with flooding can be estimated by probability or more precisely through modeling historical events. We used both approaches. Over the long term, certain areas are susceptible to flooding even without any particular hazardous event. In April 2018, for instance, the island of Kauai recorded about 50 inches of rain during a 24-hour period, which is currently being certified as a new national 24-hour rainfall record. The flood damaged a large portion of Kauai County and portions of the City and County of Honolulu. Record flooding left several people dead in April and May of 2017 in southern Missouri and northwest Arkansas, where a study of changes in the peak stream flows since 1930 indicated consistent positive increases of up to 10 percent per year.
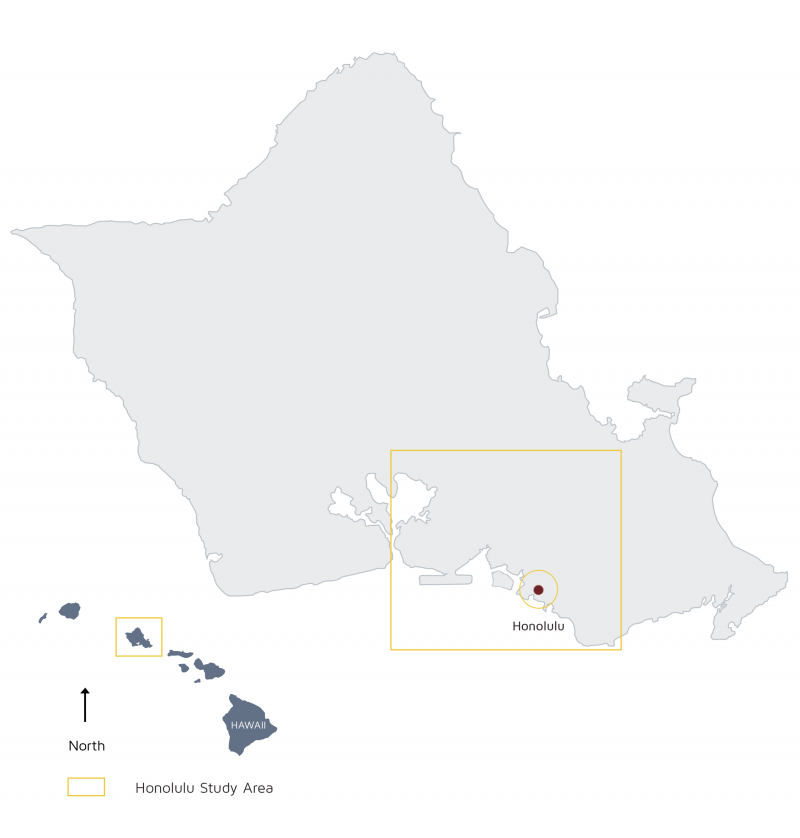
To locate areas in Honolulu that are susceptible to flooding, we used topographic and tidal data. First, we identified areas vulnerable to one meter of sea level rise and established a base water level in urban Honolulu, designated as the area between Pearl Harbor and Diamond Head (Figure 1).
Figure 1. Study area: urban Honolulu, Oahu
Three hazard models then simulated flooding in addition to the base water level. One produced storm surge flood depth, flow speed, and inundation areas for a Category 4 storm similar to Hurricane Iniki, which hit Kauai in 1992. Another simulated inundation based on five previous tsunamis that had impacted Hawaii. Another model was used to generate a 500-year river flooding, capturing inland flooding from heavy rainfall. Areas of flow inundation show the extent of the exposure to the flooding, while flood depth and flow speed illustrate the potential for damage.
Regional transport models, such as the Oahu Metropolitan Planning Organization (OahuMPO) transportation demand model, are typically used as forecasting tools to inform planning decisions. However, transportation demand models are not able to capture the nuances of the evacuation decision-making process. There are no evacuation travel surveys for Honolulu, so we used OahuMPO model estimates of expected demand for transportation infrastructure, the origins and destinations across motorized and non-motorized modes, and historical travel data to estimate how people might try to get away from each disaster.
Figure 2. Inundation due to sea level rise, tsunami, and hurricane storm surge, and inland surface flooding
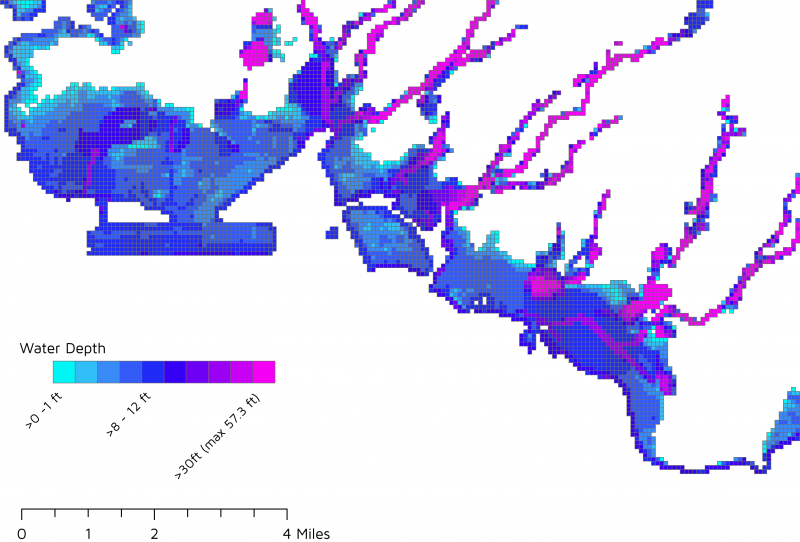
Figure 2 shows the maximum depth of anticipated flooding from sea level rise, tsunami, and hurricane storm surge, or inland river overflow in the study area. For each cell on the map, we identified the highest possible rise among the three inundation hazards — meaning if an area would flood up to three feet in a tsunami but five feet due to river overflow, we assigned it to five feet.
The “ruling hazard,” displayed below is what we call the most critical flooding type for each cell.
Figure 3. Ruling hazards for each cell
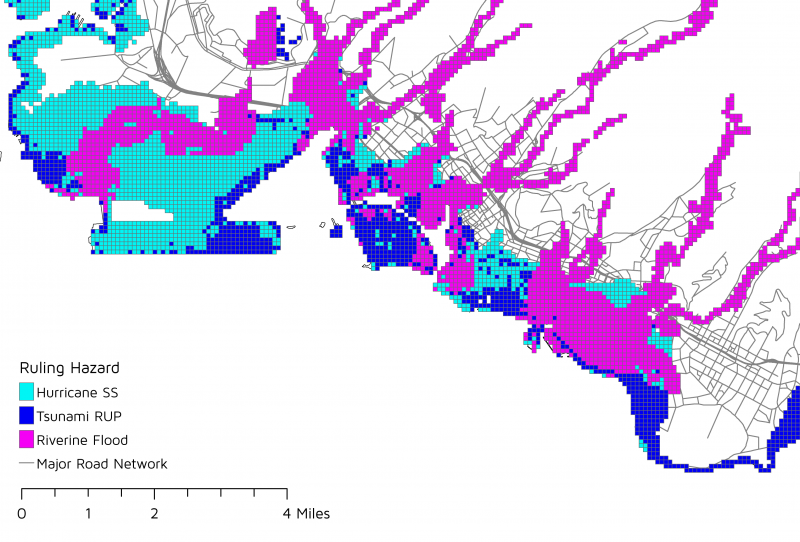
This ruling hazard analysis identified the maximum of maximums — that is, the flood type within the grid for each of the three different hazards (hurricane storm surge, tsunami run-up, riverine flooding) that causes the highest flood level for that location. This analysis indicates the predominant threat type. While deeper flooding generally means a higher risk of damage, different communities, utilities, and governments will have different responses to flooding from a tsunami versus that of a river.
A city exposed
The worst-case flooding scenarios would have a massive negative outcome on the people, economy, infrastructure, and emergency plans of the Honolulu area. 45 percent of the population — more than 150,000 people — would find their homes directly affected. For the 32,000 business establishments in the study area, we found that our scenarios would cost those businesses $34.8 billion, representing 80 percent of Honolulu’s economy. Employment data shows that nearly 213,000 jobs, or 76 percent of the area’s workforce, are exposed to worst-case flooding.
Many critical infrastructural facilities are also located in the worst flood zones, including all major electric power, oil, port, potable water, and wastewater facilities. Four out of five of the area’s hazardous material sites will be affected by worst-case flooding, along with 85 percent of communications facilities. Most of these systems are not built for resiliency during a flood and could fail when needed most.

Most infrastructural, hazardous material, and communication systems are not built for resiliency during a flood and could fail when needed most.
Most troublingly, Honolulu’s emergency response and shelter facilities are at great risk of worst-case flooding. The city recommends that residents who live near the coastline or in older, wooden houses, evacuate to these facilities in the event of a hurricane. Half of all designated emergency operations centers, fire stations, hospitals, clinics, and highway bridges are susceptible. A quarter of police stations and nearly one-third of emergency shelters, mostly public schools, are located in the inundation zones.
Charting routes to safety
The extreme vulnerability of Honolulu’s employment centers, industries, and emergency facilities makes safe, reliable travel even more vital in the event of flooding. Unfortunately, our study found that a large portion of area roadways are currently exposed to worst-case scenarios. Using the total lengths of roadways in each cell in our inundation analysis, we found that 69 percent of arterials, 44 percent of highways, 40 percent of local streets, and 38 percent of freeways would be impacted.
Table 1. Exposure of road miles by water depth
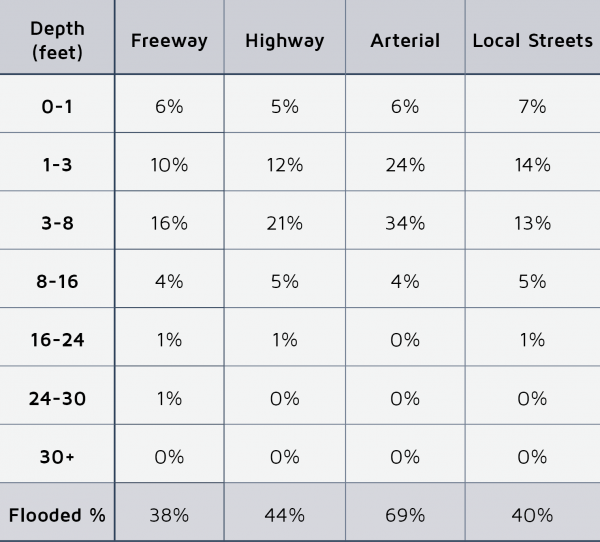
While arterials represent the highest percentage of exposure, local streets face the most risk in a worst-case flooding scenario, as they comprise more than 85 percent of all roadways in the study area — potentially rendering most roads in Honolulu impassable. And the worse the flooding gets, the more dangerous local streets become. Only a few miles of other road types would be exposed to flooding after water levels exceed eight feet, compared to the additional 32 miles of flooded local streets.
Overlaying Oahu’s travel demand model onto the flooding hazard grid reveals the extent to which flooding would shut down travel around Honolulu. Around three-quarters of all transit trips (assuming typical operations are still in effect, as largely happened in Houston during Hurricane Harvey in 2017) and more than 60 percent of trips by car would be affected, disproportionately affecting low-income households who use transit the most and have the lowest levels of car ownership. Clearly, normal travel would be significantly disrupted. But the important question for policymakers to consider is how everyone would be evacuated.
To provide a picture of what evacuation routes might look like, we calculated the distance and time by car from the center of the flooded grid to the nearest designated un-flooded evacuation center — that is, the shelters not in the inundation zone. Assuming evacuees would opt for the closest available shelter, in a minor flooding scenario we found that around 15,000 people will have to travel a total of 7,000 miles taking nearly six minutes per person. For the worst-case floods, more than 150,000 people will travel a total of nearly 120,000 miles at 20 minutes per person, more than three times that of minor flooding.
Conclusions
The analysis provides key lessons for disaster mitigation planning and evacuation planning in Honolulu and beyond. First, there is a great need to reduce the flooding exposure of the population, economy, and infrastructure by locating development away from hazardous areas. The evacuation analysis showed that time and distances needed to evacuate would be significant during a severe flooding scenario. A near-source tsunami could reach coastal communities within 25 to 30 minutes of an earthquake, so swift evacuations are key. Moreover, evacuation shelters should be assessed for their ability to withstand secondary impacts from disasters (i.e. high winds and earthquakes) and to accommodate the anticipated demand.
Currently, Honolulu has defined tsunami evacuation zones along its coast. Although coastal areas are most susceptible to flooding hazards, this study shows that the evacuation of inland communities adjacent to the drainage channels can also be a challenge during severe flooding. The April 2018 flood in Kauai resulted in the helicopter evacuation of 475 people, some stranded at inland evacuation centers due to high flood waters. Hawaiians would benefit greatly if policymakers get better at identifying safe shelters for evacuation and disseminating pre-disaster information more widely.
Hawaiians would benefit greatly if policymakers get better at identifying safe shelters for evacuation and disseminating pre-disaster information more widely.
Shelter identifications for each of the flooded communities using the location-allocation approach, and accounting for shelter capacity and logistical constraints advocated in the study, could be instrumental in saving lives during a disaster. The process also generates individualized evacuation routes to allow residents to evacuate quickly and efficiently. Short-notice evacuation is an important consideration for a city vulnerable to a near-shore tsunami event, like Honolulu. The study found 17 shelters will be in the flooded zones at the most severe flooding scenario, demonstrating the need to review existing shelter locations. Since Honolulu is prone to flooding from a multitude of hazards, staging areas, refueling locations, transfer stations, and other procedures for ensuring the safe and efficient evacuation of people from flooded homes and businesses are all essential. This may require investment in flood-proof or “safe to flood” infrastructure.
Our study also highlights the vulnerability and the susceptibility to flooding damage of the Honolulu transportation system. Transportation and emergency management decision-makers should identify critical road networks and reduce their vulnerability to natural hazards. In preparing for a disaster, transportation policies should not only focus on making evacuations quicker and safer, but work towards building a resilient transportation system that can withstand the worst possible threats of climate change and sea level rise.