
The Equalizer: Could Ride-Hailing Extend Equitable Car Access?
Can the rise of ride-hail increase mobility equity?
Ride-hail services like Uber and Lyft upend the historic link between car access and ownership by connecting riders to drivers through smartphones. The meteoric rise of these services has captivated investors, riders, planners, and policymakers alike. However, despite its high-tech luster, we do not yet know how ride-hailing serves different neighborhoods and travelers, or who, if anyone, is left behind.
The closest historical analog to these new ride-hail services is the taxi industry, which has a history of discrimination, particularly against black riders. Previous studies, mostly observing street-hail taxis, have found that taxis are far more likely to drive past or refuse service to black riders. Does ride-hailing perpetuate the inequitable status quo? Or could it represent a new chapter in on-demand car access?
Ride-hailing discrimination could harm travelers on both an individual and neighborhood scale. Addressing both is therefore critical to ensuring equitable access. Drivers refusing to pick up or drop off travelers in certain neighborhoods can impede the mobility of whole communities. If drivers refuse to pick up individuals based on race, ethnicity, or gender, then ride-hail services offer little value to many travelers, despite operating in their general vicinities.
To understand equitable access at these two scales — the individual and the neighborhood — I conducted a two-part study of ride-hail travel and equity in Los Angeles, and examined the following questions: Do ride-hail services serve neighborhoods differently based on resident characteristics? How frequently do individuals who have been historically marginalized by transportation systems use ride-hail services? Is there evidence of racial or gender discrimination against individual travelers using ride-hail services?
Measuring ride-hail access
One of the greatest challenges to understanding how ride-hailing serves neighborhoods and travelers is the dearth of fine-grain data. To begin to address this knowledge gap, I obtained a complete dataset of every Lyft trip taken to, from, and within Los Angeles County between September and November 2016 — more than 6.3 million trips in total. Each trip record included a unique rider identification number, and contained details such as the origin and destination census tracts, the time of day, the day of the week, the price, the distance, and whether the rider used Lyft or Lyft Line (now called Lyft Shared), the company’s shared ride-hailing service.
Combining this information with neighborhood-level data reflecting the local built environment and population characteristics, I examined the factors associated with ride-hail travel in neighborhoods. Specifically, I sought to discover whether Lyft drivers, like taxi drivers before them, tended to avoid low-income neighborhoods or communities of color, and which neighborhood characteristics were associated with more or less Lyft service.
In addition to determining where Lyft traveled, it was equally important to find out who was making these trips. Since it would be possible for Lyft to serve a neighborhood without serving its residents, distinguishing where Lyft goes from whom it accommodates is critical. For example, many trips could begin or end in a low-income neighborhood with plentiful nightlife destinations, exclusively serving nightlife patrons rather than area residents.
While the Lyft data offered unparalleled insight into questions of Lyft travel and usage, the data did not include any personally identifying information, and therefore offered no insight into the final question: Is there evidence that ride-hail services, like taxis before them, discriminate against individuals based on race, ethnicity, or gender? To answer this, I conducted an audit study of Lyft, Uber, and taxis in Los Angeles. Audits are field experiments designed specifically to identify discrimination by sending study participants into actual social or economic settings to measure how otherwise similar people are treated, in this case based on their race, ethnicity, or gender. Specifically, I was interested in measuring whether service qualities (wait times and cancellation rates) varied by passenger characteristics, and if so, how.
To test this, I sent 18 UCLA undergraduate and graduate students out to collect data. The students identified as either male or female, and as one of four general racial/ethnic categories: Asian, black, Hispanic, or white. To control for other factors that might influence driver behavior, the students were matched as closely as possible across other individual characteristics that were not measured, including age, ride-hail star ratings, and dress. All riders were between 20 and 30 years old and had 4.5-star ratings or higher (drivers rate riders on a scale from one (worst) to five (best) after completing trips). When collecting data, riders wore plain, non-flashy clothing, such as jeans and plain T-shirts. Each rider also uploaded a new profile photo to their ride-hail account — a headshot against a white backdrop. Lyft drivers see a rider’s name, photo, and star rating before accepting a trip request. Uber drivers see a rider’s star rating before accepting a trip request, and the rider’s name after accepting a request. Uber drivers never see a rider’s photo, even if a rider uploads one.
The UCLA student riders hailed Uber, Lyft, and taxi rides at two different locations — both centrally located in metropolitan Los Angeles along Metro’s Expo light rail line — and collected data every day (excluding holidays) between 9 a.m. and 9 p.m., seven days a week for nine weeks between October and December 2017. They hailed Uber and Lyft via the companies’ respective mobile apps, and hailed taxis via phone dispatchers. For each trip, riders recorded the following: wait time, cancellation (yes/no), and the rider’s perceptions of the driver’s race/ethnicity, gender, and age. In sum, auditors hailed more than 1,700 Uber, Lyft, and taxi trips.
Does ride-hailing extend equitable access to neighborhoods and individuals? The results of this research suggest that at both the neighborhood and individual level, the answer is yes.
Expanding car access to underserved neighborhoods
The 2016 data provided by Lyft show that between September and November of that year, the ride-hail company served nearly every neighborhood in Los Angeles County, reaching census tracts home to 99.8 percent of the county’s population. Figure 1 shows the spatial distribution of those Lyft trips, both in total trip numbers and trips per-capita (workers plus residents), to account for the uneven distribution of jobs and residents across Los Angeles County.
Figure 1. Spatial distribution of Lyft trips and trips per capita
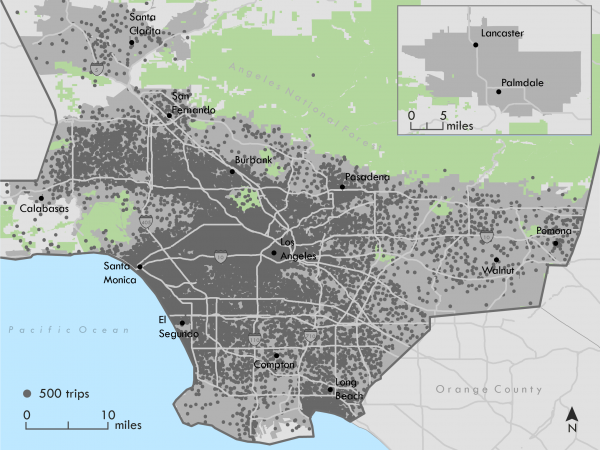
Lyft trips and trip-making are associated with the built environment. Generally speaking, more Lyft trips begin and end in high-density neighborhoods, and people take Lyft more often when they live in dense neighborhoods.
Strikingly, after controlling for neighborhood characteristics, I found no evidence that Lyft provided less service in neighborhoods based on neighborhood income or racial/ethnic majority. In fact, travelers living in low-income and majority-black neighborhoods — neighborhoods historically eschewed by taxis — took more Lyft trips per person.
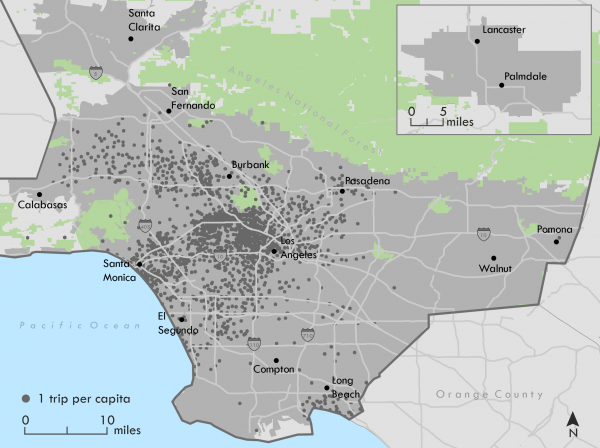
The strongest variable associated with the number of Lyft trips an individual made was neither neighborhood racial/ethnic composition nor income, but rather local car ownership. Every 10 percent increase in the share of households without a car in a given neighborhood is associated with a 7 percent increase in the number of Lyft trips a user makes. This association is inverse to the one typically observed in personal car travel. For example, the California Household Travel Survey data show that carless households in Los Angeles make just one car trip per day, compared to the average of seven daily trips made by car-owning households. Figure 2 shows that personal car access and travel increase with income, a pattern also inverse to Lyft trip-making. The contrasting patterns between Lyft usage and personal car access suggest that people use Lyft in areas where its ready substitute — the household car — is scarcest.
Figure 2. Predicted number of Lyft vs. car trips and vehicle ownership across incomes
However, not all data present a rosy picture of ubiquitous access to ride-hail services, and barriers to ride-hailing remain. On average, riders living in majority-Asian and majority-Hispanic neighborhoods take significantly fewer trips per person compared to residents of majority-white and majority-black neighborhoods. Possible explanations for this include barriers to ride-hailing, such as a lack of bank accounts or smartphones, and cultural differences in car use and carpooling across groups. These potential factors and barriers require additional study.
Upending the status quo: Increasing equity in individual car access
The audit study revealed two stark findings. First, it showed that ride-hailing is remarkably more reliable than taxi use in terms of securing a ride and reducing wait times. Second, it demonstrated that ride-hailing dramatically narrows — but does not entirely erase — racial/ethnic-based service gaps among riders. None of the results varied based on driver characteristics, meaning that the results discussed below are consistent no matter the age, race/ethnicity, or gender of the driver.
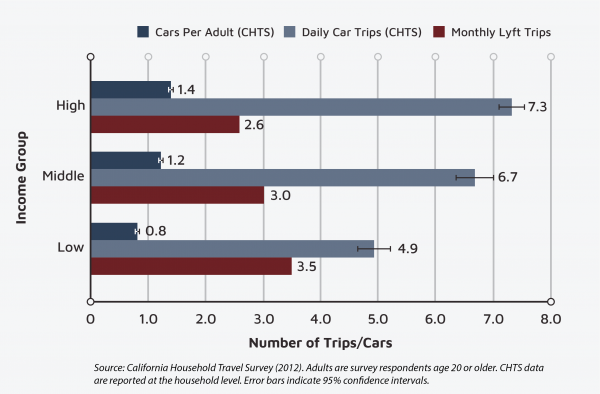
Lyft and Uber provided consistently shorter wait times than taxis. On average, ride-hail travelers waited 5.6 minutes between requesting a ride and the driver’s arrival. By contrast, taxi riders waited 24.3 minutes (four times longer) for the average cab to arrive, and more than one in 10 taxis (11 percent) failed to arrive within an hour. The highly variable taxi wait time distribution (shown in Figure 3) underscores the general unreliability of taxi services observed in this study.
Wait times did not differ appreciably between men and women, nor among white, Asian, and Hispanic riders. Wait times were, however, significantly longer for black riders than for white riders, who experienced the shortest wait times. Differences in service for black riders and white riders using Lyft, Uber, and taxis are statistically significant, and therefore unlikely due to chance. On average, black riders waited one minute and four seconds longer than white riders for Lyft, and 52 seconds longer than white riders for Uber. The starkest — and most meaningful — differences by rider race/ethnicity applied to taxis. Black taxi riders waited 10 minutes and 30 seconds longer than white riders. On average, black taxi riders waited 52 percent longer than white taxi riders.
Figure 3. Arrival time reliability across services
Nearly 20 percent of taxi riders did not receive rides because the taxi dispatcher did not pick up the phone, a taxi did not arrive within an hour, no taxis were available, or a taxi refused to provide a ride upon arrival. By contrast, just four out of 1,271 (0.3 percent) ride-hail trip requests in the study were not completed.
Cancellations translate into different rider experiences across services. For Lyft and Uber, cancellations are associated with somewhat longer wait times. However, in 99.7 percent of “canceled” Uber and Lyft trips, riders were assigned to new drivers and still reached their destinations. By contrast, taxi cancellations resulted in riders not being picked up and impeded mobility.
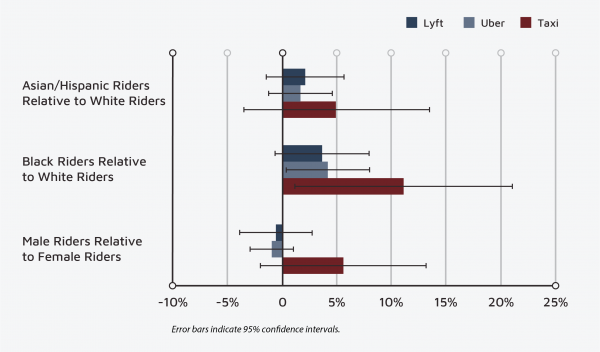
In addition to stark variation across services, cancellation rates also vary by rider race and ethnicity. Across all services, cancellation rates were lowest for white riders, moderate for Asian and Hispanic riders, and highest for black riders. Figure 4 shows the change in the probability of a Lyft, Uber, or taxi canceling on a rider of a particular racial/ethnic or gender group relative to members of other groups. No significant differences existed among Asian, Hispanic, or white riders. Black taxi riders, however, were 73 percent (or 11 percentage points) more likely to have a driver cancel compared to white riders. More than a quarter of taxis hailed by black riders were canceled, compared to about 15 percent of trips hailed by white riders. For both Lyft and Uber, the difference in the probability of a trip being canceled is far smaller. Cancellations for black riders are 4 percentage points higher than for white riders.
Figure 4. Percentage point change in probability of cancellation by rider characteristics
A role for policymakers
Ride-hailing dramatically extends car access to neighborhoods previously underserved by taxis, and appears to fill an important mobility gap by providing rides in neighborhoods where residents have the least access to personal cars. At the individual level, ride-hailing narrows, but does not erase, the service gaps associated with taxis. Each of the analyses briefly summarized here yields lessons for policymakers as they consider how to facilitate equitable access to ride-hailing and future modes of technology-enabled transportation. While equity gains can likely be achieved by mobility platforms themselves by tracking discriminatory cancellations by drivers and enforcing consequences, among other methods, I focus the remainder of this discussion on the role that policymakers can play in ensuring access to ride-hail service for all.

Ride-hailing dramatically extends car access to neighborhoods previously underserved by taxis, and appears to fill an important mobility gap by providing rides in neighborhoods where residents have the least access to personal cars.
While I found no evidence that ride-hailing excludes neighborhoods based on resident income or racial/ethnic characteristics, as taxis have historically done, my findings do suggest that ride-hailing exclusion may occur along a digital divide. Lower Lyft use in majority-Asian and majority-Hispanic neighborhoods may be partially explained by lack of access to technology. The Federal Deposit Insurance Corp. reports that Hispanic and Spanish-speaking households, in particular, are less likely to own smartphones or have bank accounts. Overcoming technological barriers and ensuring access to new mobility services, including ride-hailing, are imperative as cities and public transit agencies enter partnerships with new mobility companies to, for example, provide first/last-mile access to transit stations, or replace lightly patronized transit services in outlying areas. Without efforts to bridge this technological divide, the gap between mobility haves and have-nots may well expand. Efforts to provide access to travelers without smartphones and bank accounts already abound in bikeshare systems. For example, a San Francisco Bay Area bike program does not require a credit card, is compatible with the regional transit fare card, and allows people to sign up in-person rather than using a smartphone.
Ride-hailing represents but one of a multitude of new modes — and future mobility possibilities — enabled by technology. To ensure equitable access, no matter what comes next, planners should adopt equity-first goals and performance metrics. These equity-first metrics should show both mobility opportunities and outcomes. Opportunity metrics should reflect whether service is available, and if so, how much, by capturing, for example, the number of vehicles per capita or per mile across neighborhoods. Outcome metrics measure how well modes of transportation serve particular neighborhoods by measuring wait times and other factors. Metrics should reflect access at both the individual and neighborhood scale, given that services may vary or exclude travelers at each level. In addition to measuring who uses new mobility services, cities should adopt a metric that reflects non-users — for example, the number of users per capita in a neighborhood — to understand who may be excluded from new mobility services.
Finally, cities should use these equity-based metrics to define the data requests (or requirements) of new mobility companies. Of course, data alone will not eliminate discrimination, nor will it guarantee equitable service across urban areas. Such data can, however, help to answer policy questions more reliably than we can today, and advance equitable access to ride-hailing and other new and future mobility services.