Disruptive Transportation: The Adoption, Utilization, and Impacts of Ride-Hailing in the United States
Ride-hailing adoption has far outpaced other shared mobility modes
Ride-hailing services such as Uber and Lyft are changing the way many people travel in major cities. Due to their rapid rise in popularity, relatively light levels of regulation, and lack of available data on how, when, and why people use these services, city and transportation planners and researchers know alarmingly little about how ride-hailing is changing travel choices or how to plan for them in the future.
Nearly 10 years after these services were introduced, we still have limited research and few answers to key questions, including: To what extent do ride-hailing services influence vehicle ownership? Where is ride-hailing complementary to or competitive with public transit?
Many public agencies responsible for transportation planning in the United States — typically metropolitan planning organizations and state transportation and environmental agencies — conduct travel surveys to gather data on vehicle ownership rates, trip-making patterns, and transportation mode choice. However, these custom surveys are costly and typically administered only every five to 10 years, which is not frequent enough given our rapidly changing transportation ecosystem. To address this gap in knowledge, our research has sought to better understand the relationships among ride-hailing services, demographics, and travel behavior.
To begin quantifying the adoption and travel behavior impacts of these services, we gathered data in major metropolitan areas of the United States through travel surveys designed by our team. Our survey asked questions about the adoption and utilization of shared mobility services, including carsharing, ride-hailing, bikeshare, and more recently, shared electric scooters. The results presented in our 2017 research report are based on data that were collected from fall 2015 through spring 2016 in seven metropolitan areas: Boston, Chicago, Los Angeles, New York, the San Francisco Bay Area, Seattle, and Washington, D.C. We employed sampling methods that regional planning agencies typically use to gather data from a statistically representative sample using rigorous methods so that we could draw defensible conclusions about the population at large.
Shared mobility: A diversifying landscape
Much of prior research on the behavioral impacts of shared mobility services focused on what we term “Carsharing 1.0,” early models of carsharing where vehicles were picked up and returned to the same location, typically through hourly rentals. The shared mobility landscape has rapidly evolved and new services have been introduced, including free-floating car-sharing, ride-hailing (e.g. Uber and Lyft), and pooled or shared services (Table 1). A key takeaway from our recent research is that not all shared services should be viewed through this lens and that the adoption rates and behavioral impacts of different types of shared mobility services vary substantially.
Table 1. The evolution of shared mobility services
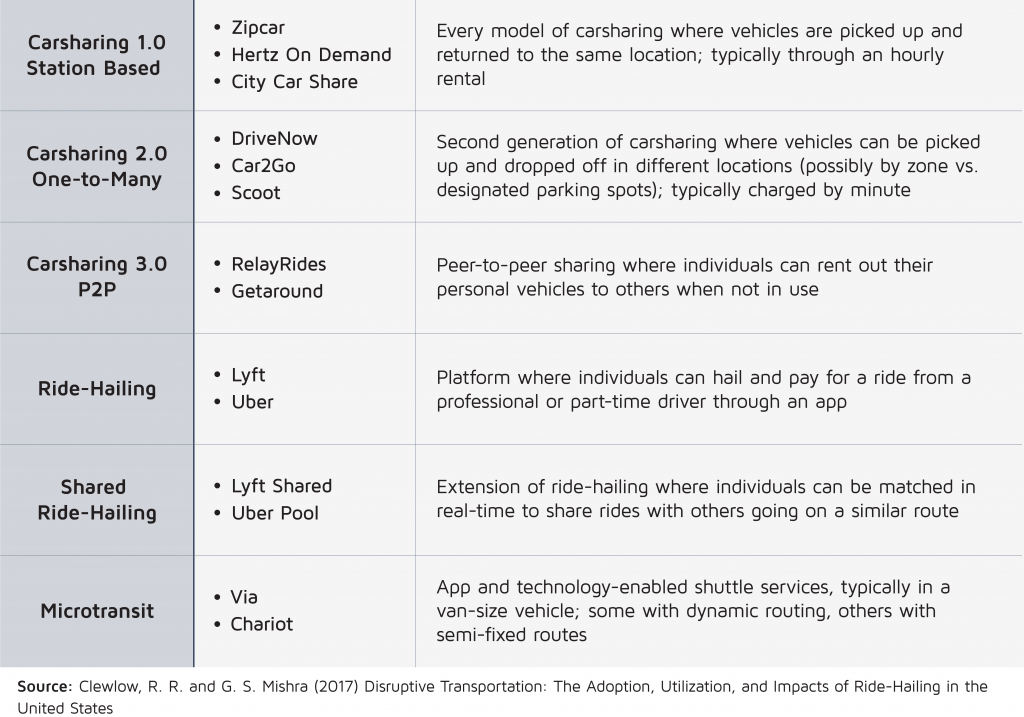
Among these various forms of shared mobility, the rates of ride-hailing adoption have far outpaced the adoption rates of other shared mobility models. Carsharing 1.0 business models had attracted only 2 million members in North America and close to 5 million globally between the early 2000s and 2017. By contrast, ride-hailing services, such as Uber, Lyft, and Didi, are estimated to have grown to more than 250 million users globally during the 2010s alone. Our more recent research on “micromobility” services, such as shared bikes, electric bikes, and electric scooters, finds that the adoption rates of these services have grown at an even faster pace than for ride-hailing.
Adoption of ride-hailing
The adoption rates, or share of the population that has used Uber or Lyft, in our study were significantly higher than those reported in previous research. While earlier studies found adoption rates of 10 to 15 percent, our 2015–2016 data found that 21 percent of adults had personally used ride-hailing services (measured as having installed and used a ride-hailing app), and an additional 9 percent of adults had used ride-hailing with friends. Our different results are likely due to our focus on major metropolitan areas and suggest that ride-hailing service use is increasingly widespread, particularly compared with adoption rates of previous generation carsharing services, which are roughly an order of magnitude smaller.
Similar to the higher ride-hailing adoption rates, we also found higher rates of utilization, or frequency of use, among ride-hailing users in cities. Nearly a quarter (24 percent) of ride-hailing users reported use on a daily to weekly basis. Such a significant portion of people relying on these services daily or weekly suggests that ride-hail is shifting from a niche to a mainstream travel option in many cities.
Similar to the adoption trends for new technologies and prior carsharing services, we found that early ride-hailing adopters tended to be younger, more educated, and have higher incomes than the rest of the population (Figure 1). Notably, we find women and minorities were more likely to adopt ride-hailing. There was a fairly significant gap in adoption between the youngest and oldest segments of the population. More than one-third (36 percent) of those between 18 and 29 years of age had used ride-hailing services, while only 4 percent of those 65 and older had. Although ride-hailing is often cited as a possible transportation solution for aging Baby Boomers, our research suggests very few of them currently utilize services like Uber and Lyft.

More than a third of 18- to 29-year-olds had used ride-hailing services, while only 4 percent of those 65 and older had.

Figure 1. Ride-hailing adoption by demographics and geography, 2015-2016
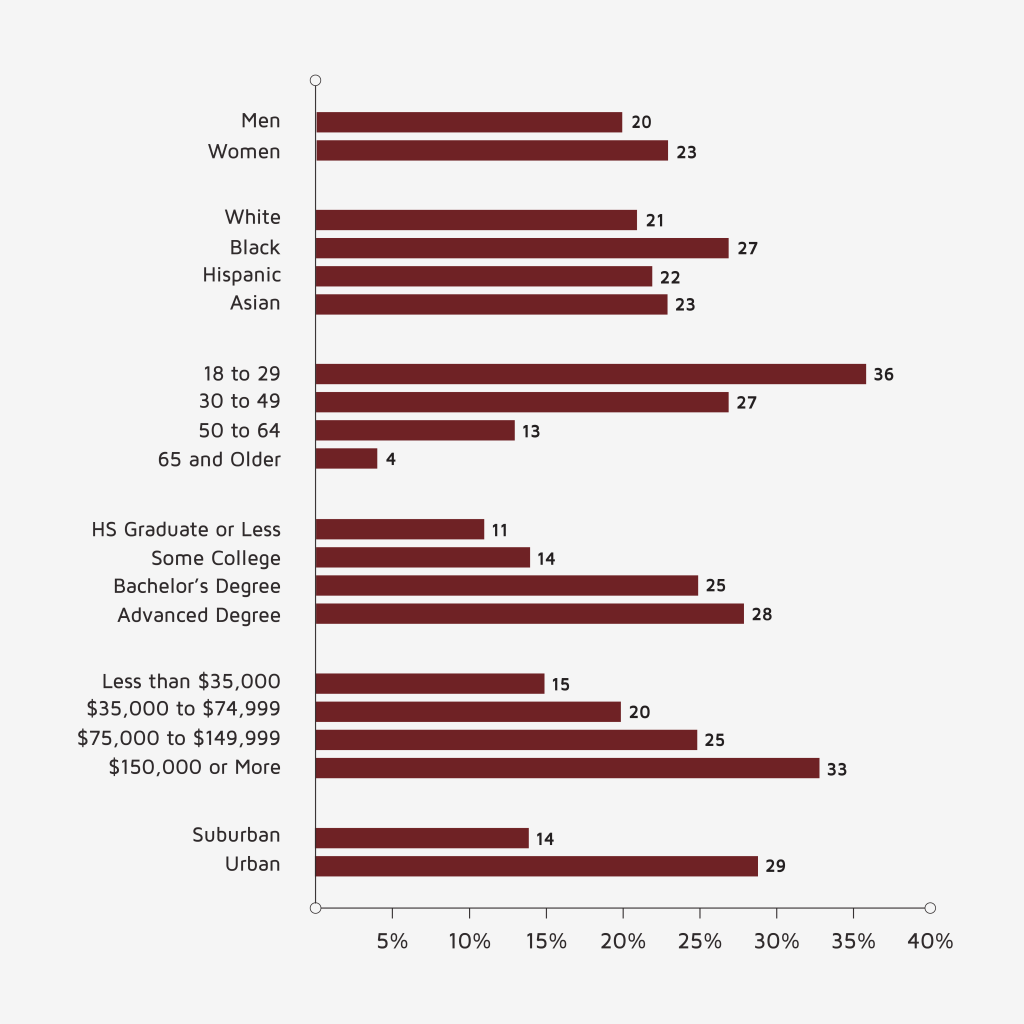
Wealthier, more educated people use Uber and Lyft at much higher rates than those who are less affluent. The adoption rate among the college educated (26 percent) was double that of those without a college degree (13 percent). Those with advanced degrees also had slightly higher adoption rates than those with only a bachelor’s degree. Similarly, respondents with annual household incomes of $150,000 or more had an adoption rate of 33 percent, compared with only 15 percent among those earning $35,000 or less.
While many observers herald these exciting new mobility options, their continuing growth presents significant challenges for the public sector. As officials and managers at cities and public transit agencies consider whether and how to integrate these services into publicly subsidized transportation networks, these gaps in adoption between the wealthy and the poor need to be addressed.
Vehicle ownership and driving
Two important questions facing transportation policymakers are whether the adoption of ride-hailing services might reduce vehicle ownership and total vehicle miles traveled. Contrary to prior research on the topic, we found that ride-hailing users on average do not own significantly fewer vehicles than their non-ride-hailing counterparts. We find, as others have, that the key drivers of vehicle ownership are household income, household structure, and urban density, the latter of which is strongly correlated with limited parking. Once these factors have been statistically controlled, we observe little difference in vehicle ownership between those who use ride-hailing and those who do not.
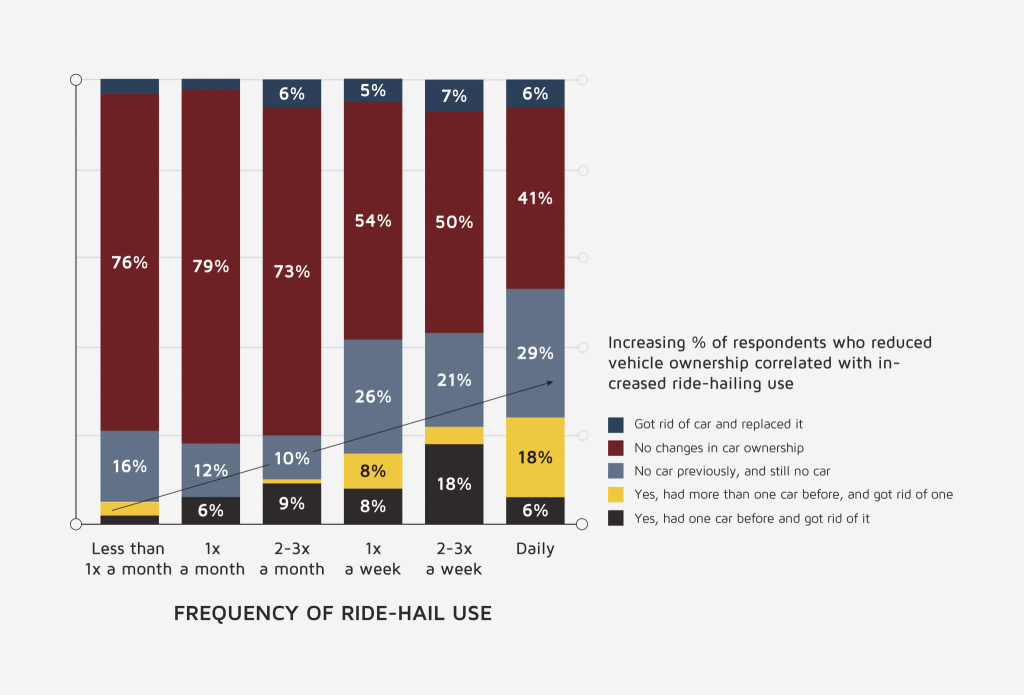
When asked whether using Uber or Lyft had prompted them to decrease their ownership of motor vehicles, the vast majority of ride-hailing respondents (91 percent) reported making no vehicle ownership changes, while 16 percent indicated they had no vehicle to begin with. However, nearly one in 10 respondents (9 percent) said they had downsized by one or more household vehicles, which suggests that Uber and Lyft may indeed motivate long-range changes to vehicle ownership and use decisions.
From an environmental perspective, a significant shift away from personal vehicle ownership is primarily of value inasmuch as it reduces vehicle-related emissions. While vehicle travel is correlated with emissions, the effect of ride-hailing on total vehicle travel is the subject of ongoing debate.
We found a strong correlation between reduced vehicle ownership and increased ride-hailing use (Figure 2). This suggests that such travelers are substituting trips in which they would have driven themselves with trips that are now driven by an Uber or Lyft driver.
Figure 2. Vehicle shedding by ride-hailing utilization rate
As we ponder the future introduction of shared, automated vehicles, trip-making and travel mode choice (i.e., walk, bike, transit, carpool, drive, ride-hail, etc.) will be central to determining whether their introduction will result in more miles traveled, more congestion, and more energy use, or whether they will be deployed to provide mobility benefits with fewer negative social, economic, and environmental impacts.
Impacts of ride-hailing on public transit
The extent to which ride-hailing complements or substitutes for public transit use will play a key role in whether Uber, Lyft, and potential automated vehicle services increase or decrease total vehicle travel. We addressed this question by assuming that not all public transit services are created equal. Some transit services are more frequent, reliable, and operate in environments where they are an especially convenient choice, while other services operating in less “transit-friendly” areas can be slow and inconvenient. In short, the question of whether ride-hailing competes with or complements public transit services depends on the context.
We asked survey respondents whether they use different public transit services, including buses, subways, and streetcars, more or less after they began using Uber and Lyft. The majority of respondents reported no change in their transit use. However, among the few who did report changing transit use, 6 percent said that they used bus services less and 3 percent said they used light rail (i.e., streetcars) less. By contrast, 3 percent of respondents reported increasing their use of commuter rail, which typically carries commuters longer distances from suburbs to central business districts. In short, we find that the substitutive versus complementary nature of ride-hailing services varies by the location, type, and quality of the transit service in question.
Recent research on New York City finds that travel has shifted away from public transit towards ride-hailing. So while many suggest that ride-hailing can be complementary to public transit by making it easier to get to and from transit stops and stations, there is mounting evidence that ride-hailing is pulling more people away from public transit than towards it.
How might the introduction and increased use of automated vehicles affect public transit use and driving? Simulations that consider whether shared automated vehicles will replace public transit services have found that total vehicle travel increases moderately-to-substantially if shared-ride automated vehicles substitute for transit use: a 6-percent increase if buses are replaced, and an 89-percent increase if high-capacity transit, like urban rail, is replaced. These simulations assume existing levels of travel demand, but most transportation economists assume that the per capita demand for travel will increase with widespread adoption of fully automated vehicles. Why more vehicle travel? Some people previously unable to drive because of age or disability could now do so, others might find riding rather than driving less onerous, and so on.
Ride-hailing and mode substitution
In our survey, we asked ride-hailing users which transportation modes they would have used for the trips they currently make using Uber and Lyft (Figure 3). The majority of respondents said that they would have traveled by walking, biking, or public transit, or would not have made the trip at all, while nearly four in 10 (39 percent) reported that they would have traveled by car (either by driving alone, carpooling, or taking a taxi). Using data unadjusted by frequency of ride-hailing use, about half (49 percent) of ride-hailing trips were likely to have been made by walking, biking, or public transit, or not been made at all.
Figure 3. Likely travel mode used if Uber/Lyft were not available for last trip
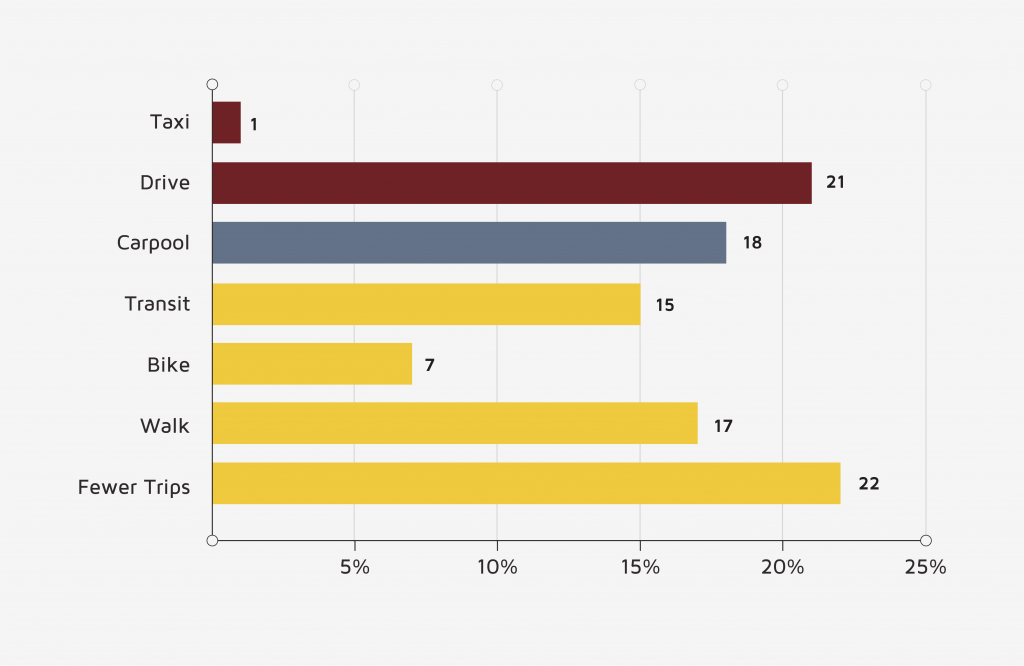
This new evidence of mode substitution suggests that ride-hailing is likely increasing vehicle travel in major cities, though to date by relatively small amounts. The 61 percent of Uber and Lyft trips that would have been made by walking, biking, or transit, or not been made at all are adding vehicles to the road. In addition, ride-hailing raises the concern of deadheading miles, or miles traveled without passengers, which have previously been estimated at 20 to 50 percent of ride-hailing miles. With deadheading miles included, the vehicle travel associated with a ride-hailing trip is potentially higher than if taken in a personal vehicle.
While these data provide initial insights into the travel behavior changes associated with ride-hailing, they only represent a snapshot of representative data from a sample of large cities in late 2015 to early 2016. Continued research in this area is needed to help cities and transportation planners make critical policy decisions such when and where to invest in public transit infrastructure, and whether and when to price or subsidize private mobility services in order to manage travel demand.
Conclusions and policy recommendations
Given the rapid growth of private mobility services, it is critical to collect data on their potential impacts on travel behavior, including vehicle ownership, vehicle miles traveled, and travel mode. Further research is needed to understand how ride-hailing will influence future traffic volumes and associated emissions so that cities can effectively manage roads, vehicles, and travel. Absent these data, cities and transit agencies are in the dark when making important decisions that influence how citizens move in their regions. Accordingly, I recommend the following to ensure that the continued growth of private mobility services leads to better urban transportation.
Pricing and/or priority to improve the flow of high-occupancy vehicles
In the near term, policymakers need to address the additional vehicle miles that ride-hailing services contribute to cities. Given limited road infrastructure and expanding urban populations, high-occupancy vehicles need to have priority rights-of-way. Both congestion pricing (of all vehicles, including the majority, which are still personally driven) and bus priority lanes (to allow buses to bypass traffic, making transit faster and more attractive) can serve as effective measures to ensure that scarce roadway space is used effectively.
Improving data access for cities and transportation planners
There is an increasing data gap between privatized mobility operators and those in the public sphere who make critical transportation planning and policy decisions. As private mobility providers continue to rapidly expand, they gather massive amounts of data about how people move in cities – data that, for the most part, are unavailable to transportation planners or policymakers. Limited data in the public sector perpetuate less-informed decision-making, which in turn can result in transportation systems that may not meet the public’s needs.
There are two potential solutions for bridging the data gap. First, the public sector can and should mandate data-sharing for new mobility operators like Uber and Lyft that travel on public streets and roads. The New York Taxi and Limousine Commission adopted regulations requiring ride-hail companies to share detailed data on rides in New York City. Provided they are sufficiently anonymized, and that cities have put in place clear policies and infrastructure to responsibly safeguard it, this type of data is essential for informed transportation decision-making. Regulators and planners can reasonably require the data because mobility operators rely on publicly funded infrastructure.
Second, the public sector can invest in more frequent data-collection efforts. While research that harnesses data from ride-hailing providers themselves may shed light on the utilization, demographics, and miles traveled of these services, the more complex decisions that individuals and households make about where to live, work, and how to get around require continued data-collection efforts through representative samples of the population. Given the pace of innovation in the transportation sector, the current pace of occasional data collection and travel analysis efforts are insufficient.
Ride-hailing services have disrupted traditional transportation providers, including public transit operators. The expansion of ride-hailing has highlighted a number of opportunities for cities to harness new technologies, data, and business models that can serve a greater portion of the population more effectively. While the introduction of private mobility services has brought about welcome innovation in the transportation sector and higher levels of mobility for many travelers, better collaboration between the public sector and these private service providers are required to ensure that these services can be effectively woven into the fabric of cities in ways that are sustainable, equitable, and safe.