25 years later, ‘Speed’ plot more plausible at 9 mph
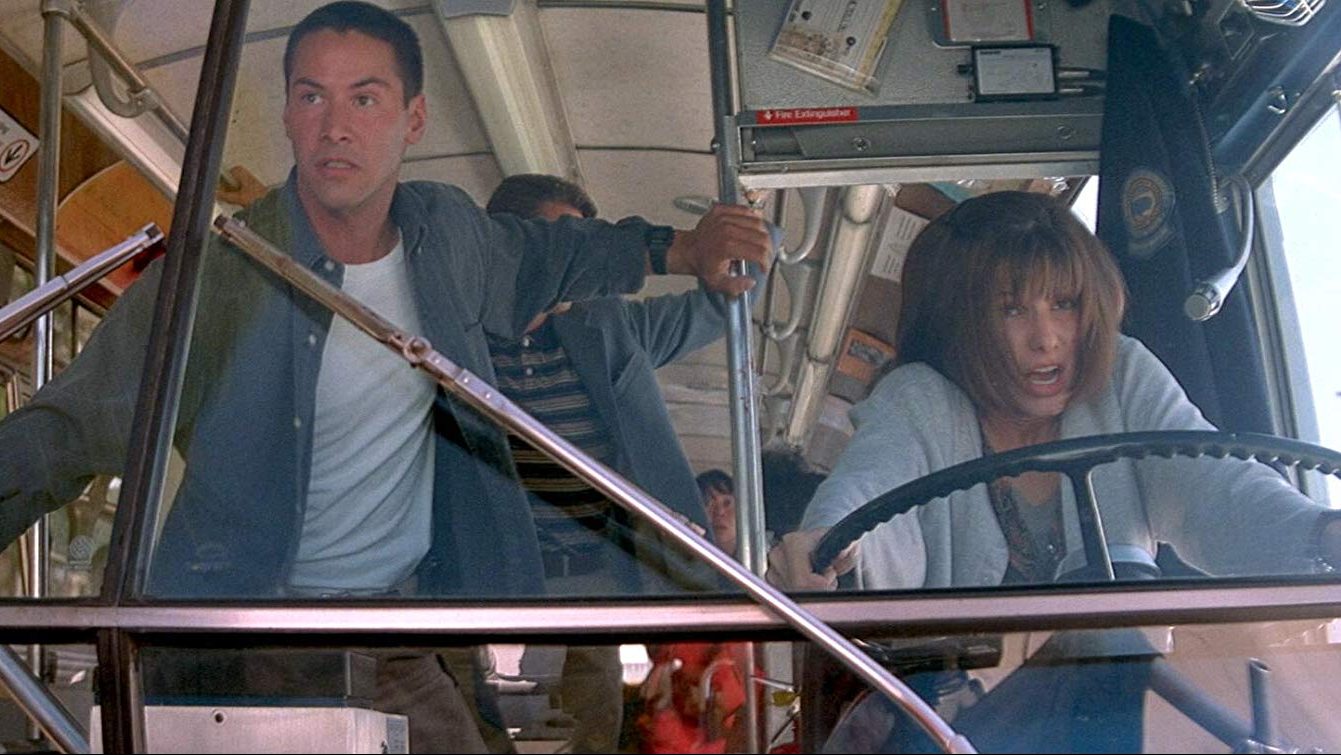
Pop quiz, hotshot: Transit ridership is declining all over Los Angeles County. If bus speeds drop, more transit passengers switch to cars. What do you do? What do you do?!
In the movie Speed, Dennis Hopper’s character places a bomb on a freeway commuter bus. Once the bus reaches 50 mph on the freeway, the bomb is armed. If the speed drops below 50 mph, the bomb goes off. Even in 1994, staying above 50 mph on an LA freeway during the 8 a.m. rush hour was a challenge.
In the movie, our LAPD hero played by Keanu Reeves is able to evacuate the passengers in an action-packed scene at LAX. The bus explodes, but the people are safe.
When UCLA ITS staff and students recently watched Speed in preparation for the movie’s 25th anniversary, I thought about how much slower Southern California buses are today than they used to be.
It turns out 1994 is a great base year for analysis, as it was the first year that all agencies reported data to the Federal Transit Administration’s National Transit Database. I compared some key metrics versus 2017, the most recent year for which data is available.
In 1994, Santa Monica Big Blue Bus had an average systemwide speed of 12.42 mph. In 2017, it was down 27 percent to 9.00 mph.
Buses spent an extra 152,228 hours to offer 2017 service levels at those reduced speeds. Put another way: that’s 17 extra years of service or enough time to watch Speed 78,738 times.
Extra time means extra costs. The slower speeds meant that in 2017, the Big Blue Bus spent an extra $12.1 million on vehicle operating costs in 2017 to offer service that they would have at 1994 speeds.
And the Big Blue Bus can’t count on fares from increased ridership to address those extra costs. In 1994, Big Blue Bus had an average occupancy of 17.26 passengers, about as many as were riding the bus in the movie. By 2017, average occupancy fell to 10.22 passengers.
How have slower speeds impacted your transit agency? Use the interactive dashboard below to see changes in average speeds, ridership, and operating costs for LA area transit systems.
So, what can Big Blue Bus do? There are well-studied options to increase speeds. For instance, high-occupancy vehicle lanes on freeways can speed up busses, vanpools, and carpools. Unfortunately, the 10 Freeway between Santa Monica and Downtown LA, where the Big Blue Bus runs Route 10 freeway express service, had its HOV lane removed in the mid-1970s. Buses could also run on freeway shoulders, as they do in Minnesota’s Twin Cities region.
For buses that run on surface streets, some go-to options include all-door boarding, transit signal priority, reducing the number of stops served, and roadway treatments.
Recent UCLA Institute of Transportation Studies research on tactical transit lanes (TTLs) suggests that transit agencies and cities should work together on quickly implementable, short-term bus-only lane pilots to learn how a bus lane would affect transit speeds, automobile speeds, pedestrian and cyclist safety, and transit passenger satisfaction.
The first TTLs appeared in 2014. Since then, they’ve been installed or piloted in 17 cities across the country. Recent TTLs have reduced their corridor peak congestion travel times by 20 to 28 percent — and up to 50 percent in one case. TTLs can produce dramatic decreases in the variability of transit travel times during peak-hour congestion, too, leading to better schedule adherence and more efficient transit vehicle dispatching.
Los Angeles has bus-only lanes, but enforcement is limited, and so are the lanes’ effectiveness at increasing bus speeds. Our TTL study found that enforcement is critical for making the lanes work. Keeping track of “hotspots,” or areas of repeated delay, enables the most efficient use of enforcement resources.
So, hotshot, keep track of hotspots, and look at implementing TTLs, all-door boarding, and other treatments that can improve bus speeds. There are lots of options for increasing bus speeds in Los Angeles — we should explore them now, or risk a more plausible Speed reboot where the bomb is set at 9 mph. Or perhaps a more contemporary take with a scooter.
Featured image courtesy of IMDB.
This is a timely article as I was wondering recently about bus speeds. It seems to me, anecdotally, that MTA buses are often being driven more slowly even when there is no traffic impeding them. I was wondering if the long headways have made the agency put more emphasis on keeping to the schedule, since missing a bus is a bigger disruption. Do you have any info on mta policy or data that addresses this?
Great work Juan! I think if you were able to add the change in arterial lane miles over time it would show that the areas where roadway capacity has been added have avoided some of the speed decreases.
… [Trackback]
[…] Read More here: transfersmagazine.org/2019/06/10/bus-speed-los-angeles/ […]