Does Light Rail Reduce Traffic? The Case of the LA Expo Line
Policymakers can focus too much on congestion relief and not enough on urban mobility and accessibility
Light rail is an attractive idea, especially in famously congested Los Angeles. Why sit stuck in traffic while the light rail glides by?
Light rail projects are booming around the United States. Reports from the National Transit Database show that between 1991 and 2012, light rail transit capacity increased from 27 million to 99 million service miles nationally. Light rail service, in fact, has grown at a higher rate than bus, subway, and other public transit modes. Los Angeles is part of this trend. LA Metro has the most ambitious urban rail transit development program in the U.S.: Projects worth approximately $8 billion are currently under construction. The first segment of the Los Angeles Expo Line, between Culver City and Downtown LA, opened in 2012 as part of this widespread recent investment.
One of the common justifications for investing in light rail is its potential to reduce roadway traffic congestion. Yet, little evidence exists to support this claim. There are many studies of the impacts of light rail, but few have examined its impacts specifically on traffic congestion.
We took advantage of a unique data set to analyze how the Expo Line affected transit ridership and road traffic in the corridor — and found that the project has had a positive impact on the former, but not much effect on the latter. Our results indicate that the real benefits of rail transit investments are not in traffic reduction, but rather in increasing the accessibility and popularity of transit within high-demand corridors.
We identified three conditions that must be satisfied for a light rail system to decrease corridor-level traffic congestion:
- A net increase in transit service and accessibility, relative to previous transit services within the service corridor, in order to attract new passengers rather than those who already used transit. The increase must be large enough to be perceived by individual travelers.
- Potential demand for transit travel within the corridor must be enough to generate more passengers. Specifically, enough existing travelers must be willing to shift to transit and new travelers must be willing to choose transit over other modes if quality transit service such as light rail is introduced within the corridor.
- The new transit system should not interfere with or slow down roadway traffic within the corridor.
If these conditions are met, light rail systems can attract new riders by promoting car-to-transit shifts, and thereby reduce congestion, improve mobility and reliability of travel, and increase person throughput across their service corridors.
“A natural experiment”
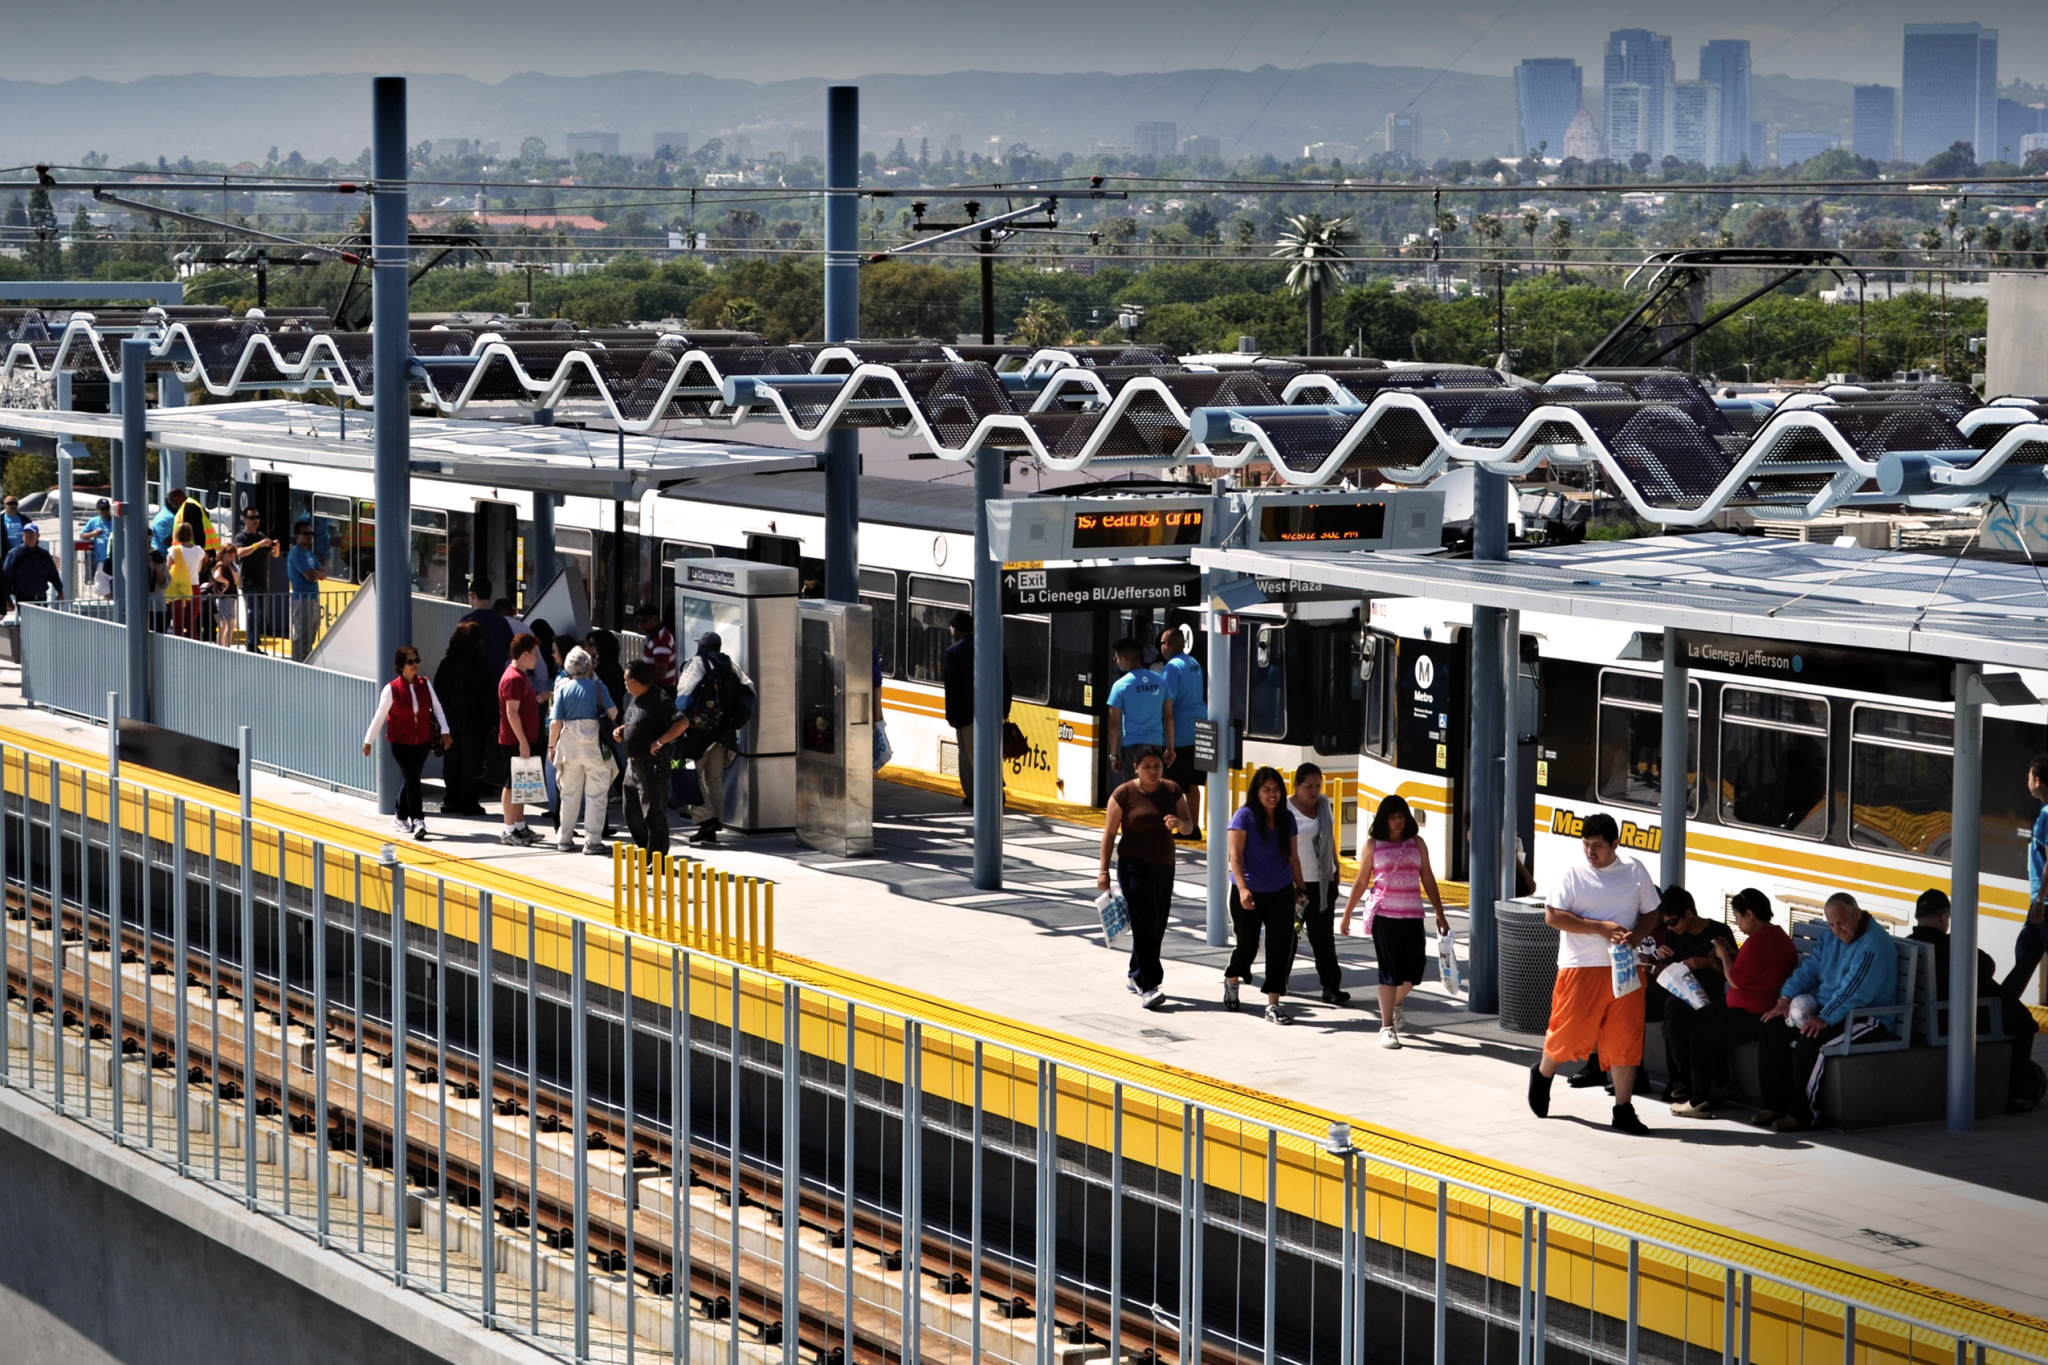
The first operating phase of the Expo Line connected Downtown Los Angeles with Culver City (Figure 1), running east-west for nearly nine miles through a dense and congested part of the city. The line is roughly parallel to the I-10 freeway, and both the corridor and several parallel arterials have extensive bus transit service: Metro’s local and rapid buses, Culver CityBus, and Santa Monica’s Big Blue Bus routes. As the corridor suffers from heavy peak-period traffic, Metro marketed the Expo Line as a means to increase transit mode share along I-10 between downtown and the Westside, noting that it would provide Angelenos “real options for parking their cars, hopping on the bus or train and beating high gas prices.”
Figure 1. Expo Line Phase 1 alignment
![]()
We wanted to answer two questions about the Expo Line: Did it significantly increase transit ridership within the I-10 corridor? And did it reduce traffic congestion and improve travel time reliability along the I-10 freeway and nearby parallel arterials during weekday peaks?
The Expo Line addition resulted in a small increase in transit service supply within its corridor — about 4 percent more vehicle hours of service. A subsequent net increase in transit ridership along this service increase is a necessary but not sufficient condition for any measurable impact on traffic. Even if transit ridership increased, we needed to determine whether the increase was enough to affect traffic performance, which depends on the magnitude of transit service increase and where the new passengers come from. If new passengers are mainly previous car users, this could signal more of a potential traffic benefit than if they were previously using other transit routes or modes, biking, walking, or not traveling at all.
So what happened after the line opened? Expo saw around 20,000 average daily boardings in the three-month period immediately after the opening of the line. Comparatively, the annual average daily traffic on the I-10 freeway within the corridor is about 300,000 vehicles.
Given such a difference in scale, we did not expect dramatic shifts in traffic as a result of the Expo Line. We knew that measuring small changes in traffic performance and attempting to attribute those changes to the Expo Line would be challenging. All the other changes taking place in the corridor, such as traffic signal timing or fluctuations in fuel price, would affect the measurements, too.
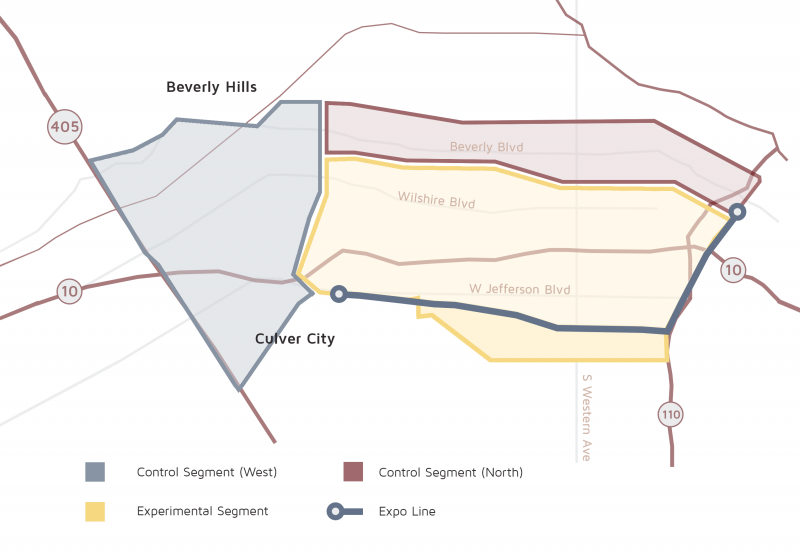
Challenges aside, the Expo Line opening was a “natural experiment,” giving us the opportunity to evaluate corridor changes. In order to isolate the new line’s effects, we used a research design that compared transit use and traffic system performance in the corridor before and after the line’s opening, relative to changes in a control corridor. For our control, we identified two similar locations not affected by the opening and performed the same before/after comparison (Figure 2). Our data covered two three-month periods, one before the opening (November 2011 to January 2012) and one after (November 2012 to January 2013). Expo Line service began in June 2012.
We selected control corridors that were comparable to the experimental corridor in terms of baseline conditions as well as in changes to transit demand and traffic system performance. We used three different measures of traffic system performance:
- Average speed, which indicates level of congestion
- Standard deviation of speed, an indicator of day to day variation
- Average buffer time, which, according to the Federal Highway Administration, “represents the extra time (or time cushion) that travelers must add to their average travel time when planning trips to ensure on-time arrival.”
Figure 2. The experimental and control corridors
How we assembled our Big Data
In 2010, our research team at the USC METRANS Transportation Center partnered with LA Metro to develop the Archived Data Management System (ADMS), a massive volume of geocoded and time-stamped streaming data from a variety of highway and transit sources. The system allows researchers to conduct detailed studies that were previously either impossible or extremely costly to perform. Examples include the impacts of new transportation investments such as subway line construction, policy shifts such as fare increases, and exogenous shocks such as gas price changes.
ADMS served as the principal data source for this study. Across the traffic corridors, 74 freeway and 1,066 arterial sensors provided traffic performance data on speed, volume, and occupancy roughly every 30 seconds. These were aggregated into 15-minute averages to smooth out the random fluctuations in traffic patterns while still capturing short-term changes in performance.
The final set included more than 816,000 freeway data points and more than 15 million arterial data points, across both the before and after periods. The transit data from LA Metro included configurations of bus and rail routes, the locations and boarding/alighting counts of stops and stations, and planned service schedules. We additionally accounted for transit network and schedule changes that are typically implemented in June and December.

It appears that the benefits of light rail investments are in increasing transit accessibility and person throughput within high-demand corridors, not in reducing congestion.
Our ADMS data led us to two important findings: The Expo Line had a positive response on transit ridership, but a small and localized effect on roadway traffic. It appears that the benefits of light rail investments are in increasing transit accessibility and person throughput within high-demand corridors, not in reducing congestion.
Transit ridership impacts
Our results suggest that the Expo Line positively affected local transit ridership along its corridor. Average total weekday boardings across all bus stops and rail stations increased by 6 percent in the experimental corridor and decreased by 4 percent in the control corridors. The increase in transit supply, measured in terms of revenue vehicle hours, was greater in the experimental corridor (4 percent) than the controls (0.1 percent). Thus the ridership gain may be partially attributed to the overall increase in transit service.
We also found that weekday ridership, measured as boarding counts at each stop or station, increased by 7 percent on east-west transit lines within the Expo Line corridor. Boardings on east-west lines in the control corridors decreased by 2 percent. We estimated that the number of people riding transit in both directions during weekday peak periods increased by 14 percent in the experimental corridor and decreased by 3 and 8 percent, respectively, in the control corridors. Finally, we found that bus boardings increased significantly near Expo Line stations with feeder bus connections — a combined effect of new transit trips and redistribution of existing transit trips induced, at least in part, by the Expo Line.
Traffic effects
A net reduction in traffic levels seemed plausible given the Expo Line’s effect on transit ridership, as auto-to-transit shifts could have contributed to the observed increase in transit trips. We analyzed impacts of the Expo Line on weekday mornings from 7 to 10 a.m. and evenings from 4 to 7 p.m., monitoring peak-period traffic speed and travel time reliability for the I-10 freeway, Venice Boulevard (which runs roughly parallel to the Expo Line and is an alternate route to I-10), and other major east-west arterials. Again we compared traffic performance in the same before and after periods within the Expo Line and control corridors.
Overall, we found no significant changes in speed variability and no consistent travel time reliability impacts on the freeway. However, on Venice Boulevard, we found large relative improvements in westbound traffic speed and travel time reliability in both peak periods across the experimental segment of the roadway. These improvements, however, were largely due to worse traffic conditions in the control segments. The magnitude of this traffic deterioration is not consistent with regional trends, and we were not able to identify a satisfactory explanation. Therefore we find impacts on Venice traffic to be inconclusive.
A quick comparison of before and after weekday peak-period traffic speeds along all major parallel arterials suggests a localized positive effect of the Expo Line. Relative to an arterial (West 3rd Street) located far north of the Expo Line within a designated control corridor, we found average speeds across nearby arterials such as Martin Luther King, Jefferson, and Washington Boulevards to have significantly improved in both peak periods and in both directions. A separate set of analyses suggest that the signal priority provided to Expo Line trains could have positively affected travel speeds on the nearby parallel arterials. The reduction in bus service that took place on the parallel arterials could also have had a positive effect, as fewer buses in mixed lanes could increase average traffic speeds for cars.
What we learned
Our research suggests that the Expo Line Phase 1 had a modest and highly localized impact on weekday peak-period roadway traffic system performance within the first 5 to 7 months of opening. The number of daily Expo Line trips was small compared to the total volume of traffic within the service corridor, so even if all Expo Line riders were previous car users, it is unlikely that the reduction in traffic volume would translate into significant improvements in speed and travel time reliability within the highly congested corridor.
When traffic improves, drivers who shifted to less preferred modes or time periods, or stopped making the trip altogether in response to congestion, will be attracted back to previous behavior.
In the longer term, any short-term traffic reductions on arterials would likely be offset by latent demand. When traffic improves, drivers who shifted to less preferred modes or time periods, or stopped making the trip altogether in response to congestion, will be attracted back to previous behavior, using up the available capacity and eventually any performance improvements in the corridor.
The potential of light rail to reduce congestion is indeed limited, particularly in high-demand areas such as the core of Los Angeles. But that’s not a reason to abandon light rail projects. Rather, policymakers should remember that the fundamental purpose of light rail investments is to promote transit use and increase person throughput across their service corridors. Light rail can effectively contribute to urban mobility and accessibility even if it can’t reduce traffic congestion.